


SanDisk Corporation Stock (SNDK) Moved Down by 3.05% on Oct 29: Facts Behind the Movement
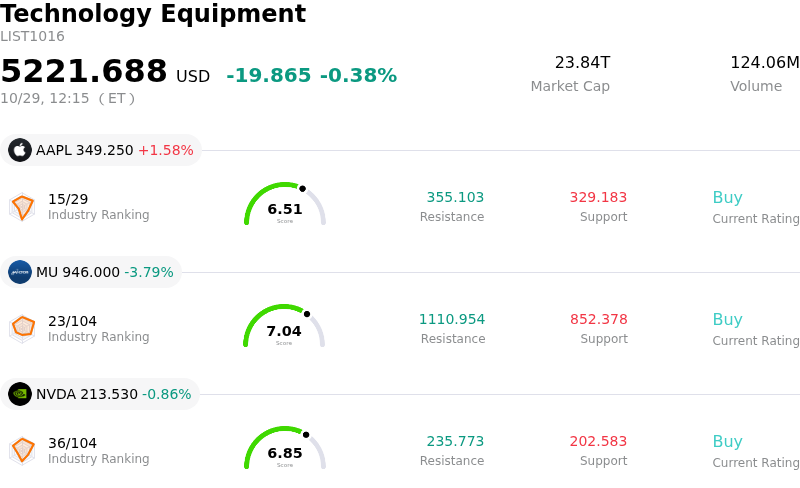
SanDisk Corporation (SNDK) moved down by 3.05%. The Technology Equipment sector is down by 0.38%. The company underperformed the industry. Top 3 stocks by turnover in the sector: Apple Inc (AAPL) up 1.58%; Micron Technology Inc (MU) down 3.79%; NVIDIA Corp (NVDA) down 0.84%.
What is driving SanDisk Corporation (SNDK)’s stock price down today?
SanDisk Corporation traded lower amid broader tech sector weakness and heightened caution across the digital storage ecosystem. Market sentiment in the memory and semiconductor hardware space was pressured by earnings updates and capital expenditure commentary from major technology hyperscalers, notably Alphabet and Microsoft. Concerns regarding the trajectory of artificial intelligence infrastructure budgets and potential moderation in near-term data center spending weighed on storage component suppliers, offsetting recent positive momentum across the broader memory sector.
Company-specific positioning ahead of SanDisk's scheduled quarterly earnings release further contributed to intraday selling pressure. Options market activity indicated expectations for significant price movement surrounding the earnings event, prompting institutional and retail investors to de-risk positions following a previous rally. While recent contract pricing for enterprise solid-state drives and long-term supply agreements with cloud providers have underscored fundamental strength, investor sensitivity toward peak cyclical NAND pricing and customer concentration risks drove temporary profit-taking.
From an institutional perspective, short-term volatility reflects broader macroeconomic repositioning and sector-wide sentiment rather than immediate operational deterioration. SanDisk's multiyear supply agreements with cloud and edge data center customers, combined with high margin profiles in enterprise storage, provide structural visibility for revenue growth. Investors will remain focused on management's upcoming guidance and comments regarding hyperscaler demand to gauge whether current memory supply-demand dynamics can sustain long-term valuation levels.
Technical Analysis of SanDisk Corporation (SNDK)
Technically, SanDisk Corporation (SNDK) shows a MACD (12,26,9) value of -7.424, indicating a sell signal. The RSI at 42.905 suggests neutral condition and the Williams %R at 56.346 suggests sell condition. Please monitor closely.
Media Coverage of SanDisk Corporation (SNDK)
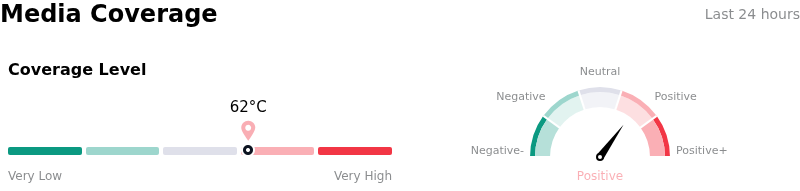
In terms of media coverage, SanDisk Corporation (SNDK) shows a coverage score of 62, indicating a high level of media attention. The overall market sentiment index is currently in bullish zone.
Fundamental Analysis of SanDisk Corporation (SNDK)
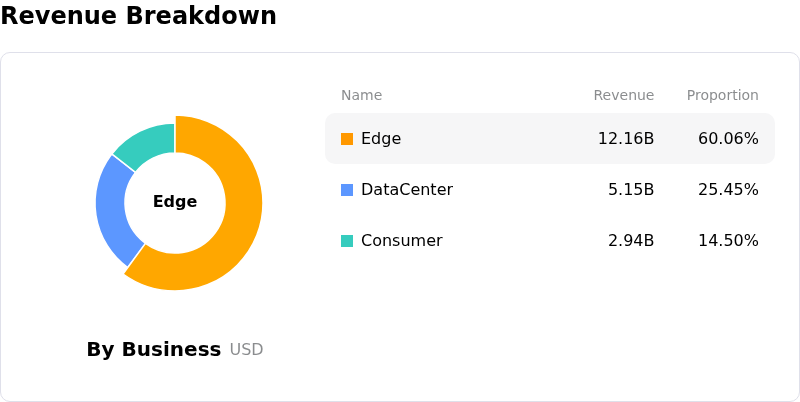
SanDisk Corporation (SNDK) is in the Technology Equipment industry. Its latest annual revenue is $20.25B, ranking 8 in the industry. The net profit is $11.43B, ranking 2 in the industry. Company Profile
Over the past month, multiple analysts have rated the company as Buy, with an average price target of $2104.46, a high of $3000.00, and a low of $1020.00.
More details about SanDisk Corporation (SNDK)
Company Specific Risks:
- Hyperscale AI Spend Spillover Concerns: Intraday pressure on SNDK has intensified following weak earnings and reduced capital expenditure signals from major cloud hyperscalers like Alphabet and Microsoft, raising investor fears of a near-term slowdown in AI data center storage demand.
- Elevated Post-Earnings Implied Volatility: Options markets are pricing in an 8.09% move following today's Q1 FY2027 financial report, exposing the stock to severe downside price swings if results or forward guidance fail to exceed high Wall Street expectations.
- NAND Flash Memory Cyclicality and Pricing Peak: As a commodity NAND flash supplier without an economic moat, SanDisk remains vulnerable to memory cycle downturns, with recent price momentum showing signs of decelerating toward potential margin compression.
- Storage Sector Contagion and Consumer Demand Headwinds: SNDK continues to suffer from broader storage sector selloffs alongside peers like Seagate and Western Digital, as high memory prices begin to pressure downstream consumer electronics shipments and end-market demand.
Recommended Articles


