


Spotify Technology SA Stock (SPOT) Moved Down by 3.10% on Oct 28: A Full Analysis
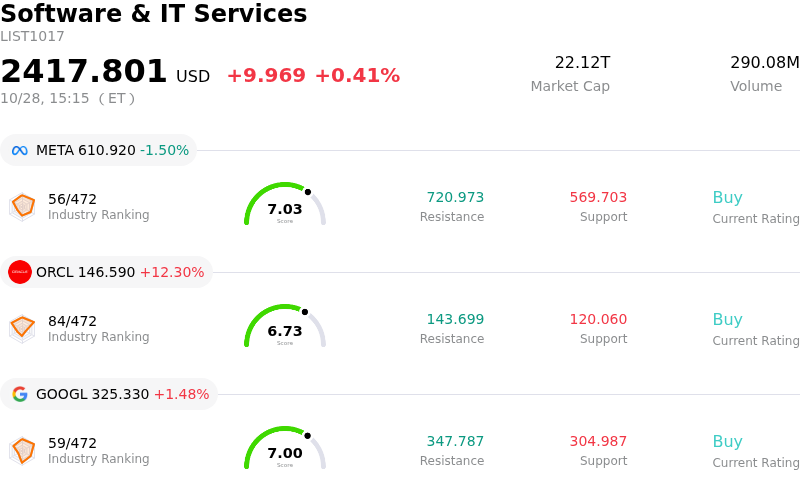
Spotify Technology SA (SPOT) moved down by 3.10%. The Software & IT Services sector is up by 0.41%. The company underperformed the industry. Top 3 stocks by turnover in the sector: Meta Platforms Inc (META) down 1.52%; Oracle Corp (ORCL) up 12.23%; Alphabet Inc Class A (GOOGL) up 1.49%.
What is driving Spotify Technology SA (SPOT)’s stock price down today?
Spotify experienced downward pressure today as market participants engaged in profit-taking following a multi-day post-earnings rally. The audio streaming giant recently reported its third-quarter financial results, presenting a mixed operational picture for investors. While top-line revenue and subscriber metrics outperformed guidance, bottom-line adjusted earnings per share fell short of Wall Street estimates. Higher investments in cloud infrastructure, artificial intelligence capabilities, and global marketing campaigns weighed on profitability, prompting some investors to secure gains following the stock's recent advance.
Despite the earnings miss, Spotify displayed strong underlying operational metrics. Total monthly active users and premium subscribers surpassed internal targets, driven by steady gains across international markets and effective promotional initiatives. Gross margins expanded to record third-quarter levels, supported by growth in premium average revenue per user and a accelerating recovery in programmatic ad sales. Furthermore, management highlighted expanding monetization opportunities from its global audiobook rollout and creator programs. However, with the stock trading at a demanding forward earnings multiple, the equity remains sensitive to near-term bottom-line fluctuations whenever operating expenditure growth temporarily outpaces earnings leverage.
Broader market dynamics and persistent investor debate regarding technology disruption also influenced trading activity. While sell-side analysts maintain that Spotify's brand ecosystem and subscription model remain resilient against artificial intelligence disintermediation, uncertainty surrounding AI-driven content shifts continues to generate periodic volatility across the streaming sector. Additionally, routine insider stock sales disclosed in recent SEC filings and institutional portfolio adjustments within communication services funds added to the intraday selling pressure. While Spotify's long-term market leadership and free cash flow generation remain strong, short-term stock movements reflect an ongoing recalibration between high valuation multiples and ongoing cost discipline.
Technical Analysis of Spotify Technology SA (SPOT)
Technically, Spotify Technology SA (SPOT) shows a MACD (12,26,9) value of 6.946, indicating a buy signal. The RSI at 52.064 suggests neutral condition and the Williams %R at 63.924 suggests sell condition. Please monitor closely.
Fundamental Analysis of Spotify Technology SA (SPOT)
Spotify Technology SA (SPOT) is in the Software & IT Services industry. Its latest annual revenue is $20.44B, ranking 22 in the industry. The net profit is $2.63B, ranking 22 in the industry. Company Profile
Over the past month, multiple analysts have rated the company as Buy, with an average price target of $639.99, a high of $784.98, and a low of $460.00.
More details about Spotify Technology SA (SPOT)
Company Specific Risks:
- Quarterly Top and Bottom-Line Miss: In its recent Q3 earnings report, Spotify delivered GAAP earnings per share of €2.48 ($2.81), missing consensus analyst expectations of $3.18, alongside revenue of €4.97 billion ($5.63 billion) that fell short of Wall Street estimates. This shortfall has intensified investor scrutiny regarding the company's growth velocity.
- Wall Street Analyst Downgrades: Research firms, including President Capital Management and Phillip Securities, have issued stock downgrades for Spotify to Neutral and Moderate Buy, citing valuation overextension following recent price rallies. Analysts express concern that high forward valuation multiples leave the equity exposed to sharp retracements if growth moderates.
- Sluggish Advertising Growth and Audiobook Expansion Drag: While Premium subscription additions remain reliable, Spotify's ad-supported business segment continues to experience sluggish top-line growth. Concurrently, aggressive capital outlays to expand audiobook access to over 180 global markets and introduce AI DJ capabilities are placing pressure on near-term profitability.
- Insider Liquidation and Sector Contagion: Significant insider selling, totaling over $35 million in shares over recent months with no insider purchases, has weighed on market sentiment. This executive selling, combined with broader weakness across streaming media peers, has exacerbated intraday profit-taking and elevated price volatility.
Recommended Articles


