

Solana (SOLUSD) Is down 1.29% on Sep 15: Key Drivers to Watch

Source Tradingkey

Solana (SOLUSD) is down 1.29% at Sep 15 20:10(ET), now at $101.65, with a 7-day down of 0.43%.
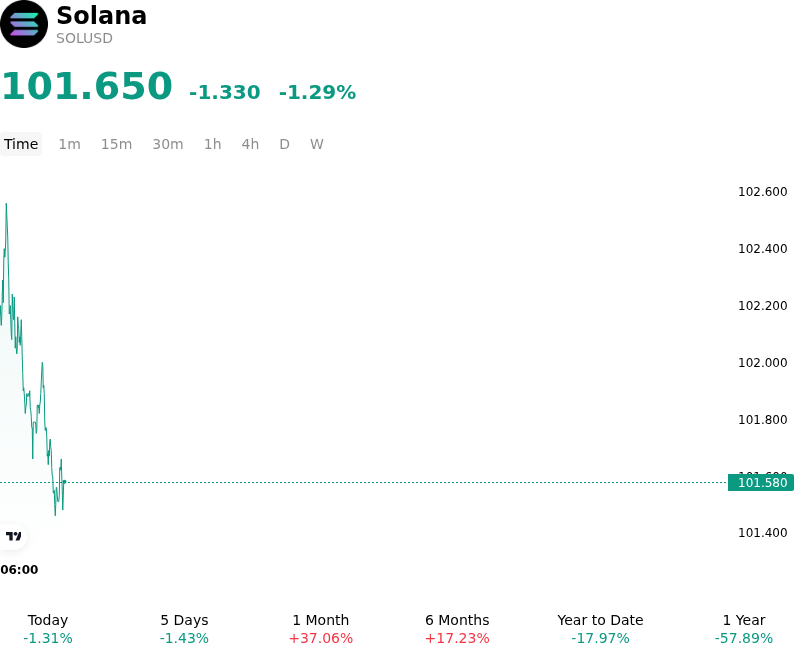
SummaryOverview

What is driving Solana (SOLUSD)’s stock price down today?

Solana experienced downward pressure as market participants engaged in tactical de-risking ahead of major regulatory and macroeconomic catalysts. Investor caution escalated ahead of a critical US Senate procedural vote on the CLARITY Act, which aims to establish a comprehensive federal framework and divide oversight between digital asset regulators. Given legislative uncertainty and cautious positioning ahead of the Federal Reserve monetary policy decision, capital flows shifted toward a defensive stance across high-beta digital assets. This led to a cleanup of open interest in perpetual futures contracts, with traders trimming leveraged long exposure to navigate potential volatility.

The pullback also reflects standard profit-taking and liquidity consolidation following Solana's recent price expansion toward major technical resistance levels. Following a strong rally fueled by institutional adoption and the activation of the network's Transaction V1 upgrade, which expanded block capacity and transaction throughput, buying momentum faced overhead supply. Funding rates in derivatives markets normalized from elevated levels, confirming that short-term momentum traders chose to lock in profits rather than absorb regulatory event risk. While spot Solana ETF inflows have provided structural capital support in recent weeks, spot market demand temporarily softened during the session as institutional desks held back fresh allocations.

Despite short-term intraday volatility, Solana's core network metrics and ecosystem adoption remain structurally sound. Fundamentals continue to be anchored by record decentralized application revenue, sustained daily active wallet expansion, and growing institutional interest in real-world asset tokenization on the chain. Institutional investors remain focused on how incoming regulatory clarity could expand compliant access to high-throughput smart contract platforms, while keeping a close eye on global liquidity conditions and interest rate expectations as key macro drivers for the asset class.

Technical Analysis of Solana (SOLUSD)

Technically, Solana (SOLUSD) shows a MACD (12,26,9) value of -1.976, indicating a neutral signal. The RSI at 58.302 suggests neutral condition and the Williams %R at 47.485 suggests neutral condition. Please monitor closely.
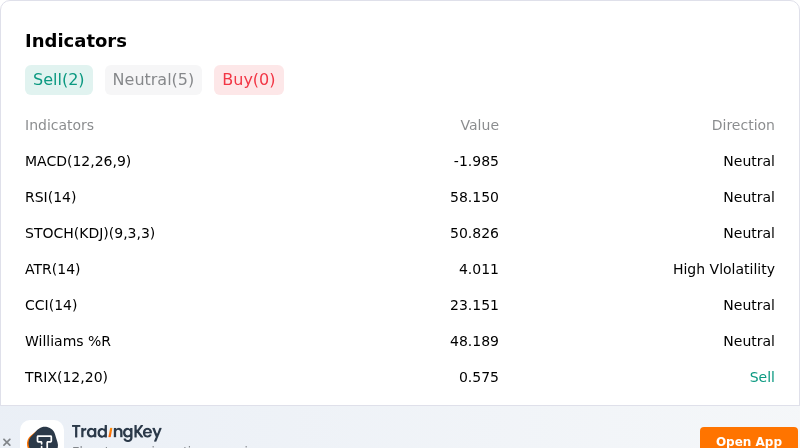
IndicatorAnalysis

More details about Solana (SOLUSD)

Recent Events and Risks:

  • Key Support Breakdown and Long Liquidation Risk: SOL recently slipped below the critical $100 psychological support level, exposing crowded derivative market positioning where nearly 70% of accounts remain positioned long, significantly increasing the risk of cascading long liquidations.
  • SIMD-0437 Supply Expansion Pressure: The mainnet activation of Phase 2 of the SIMD-0437 rent reduction proposal made approximately 612,000 SOL (valued near $62.5 million) reclaimable by network account holders, creating localized downside supply pressure as reclaimed tokens become liquid.
  • Ecosystem Token Unlocks and Liquidity Fragmentation: Multi-million dollar token unlock schedules across prominent Solana ecosystem protocols throughout September—including over $60 million in linear vesting from major ecosystem tokens—are fragmenting spot market liquidity and creating broader market drag.
  • Third-Party Operational Security Vulnerabilities: Solana Mobile was forced to suspend its marketing communication channels following a security breach at third-party email provider Brevo, elevating phishing risks and renewing market concerns over operational security.
Disclaimer: For information purposes only. Past performance is not indicative of future results.
placeholder
US dollar clings to nine-week lows near 98.4 as Brent nears $100 and the yen hits a seven-month high — five events to watch todayThe dollar is pinned near nine-week lows even after a blockbuster jobs report, as an oil spike toward $100, a surging yen and China's reflation data crowd the driver's seat. Five key events to watch today: Brent at $99.46, USD/JPY at 154, China CPI/PPI, PBOC gold buying, and Thursday's PPI / Friday's CPI ahead of the September 15-16 FOMC.
Author  Eric Nkando
Sep 09, Wed
The dollar is pinned near nine-week lows even after a blockbuster jobs report, as an oil spike toward $100, a surging yen and China's reflation data crowd the driver's seat. Five key events to watch today: Brent at $99.46, USD/JPY at 154, China CPI/PPI, PBOC gold buying, and Thursday's PPI / Friday's CPI ahead of the September 15-16 FOMC.
placeholder
US August CPI lands tonight: after a 5.4% PPI shock, will the Fed hike on September 16?US August PPI came in at 5.4% year-on-year, above the 5.3% consensus, with core PPI at 4.6%. Traders have pushed the odds of a 25bp Fed hike on September 15-16 to around 70%. Tonight's CPI is the last major inflation print before the decision — here is the full calendar, the consensus numbers, and what a hot versus cool reading would mean for the dollar, yields, gold and stocks.
Author  Irene Q.
Sep 11, Fri
US August PPI came in at 5.4% year-on-year, above the 5.3% consensus, with core PPI at 4.6%. Traders have pushed the odds of a 25bp Fed hike on September 15-16 to around 70%. Tonight's CPI is the last major inflation print before the decision — here is the full calendar, the consensus numbers, and what a hot versus cool reading would mean for the dollar, yields, gold and stocks.
placeholder
Brent tests $108 as a key export pipeline stays shut — can the rally clear $110?Brent crude rose 2.55% to $106.97 and WTI 2.32% to $102.30 as a major regional export pipeline remained offline with no restart timeline. Front-month backwardation has widened to $5.53 from $3.84 a week ago, European gas is at its highest since December 2022, and one analyst sees $119.48 if talks stall.
Author  Irene Q.
18 hours ago
Brent crude rose 2.55% to $106.97 and WTI 2.32% to $102.30 as a major regional export pipeline remained offline with no restart timeline. Front-month backwardation has widened to $5.53 from $3.84 a week ago, European gas is at its highest since December 2022, and one analyst sees $119.48 if talks stall.
placeholder
Fed hike odds near 90% into Wednesday's decision — how to trade the dollar, gold and the S&P 500A 0.3% monthly core CPI print has lifted the market-implied probability of a 25bp Fed hike on 16 September to roughly 86.5% ~ 90%, which would be the first increase since July 2023. Here is the decision timeline, the pricing versus the forecasts, both scenarios, and the key levels for the dollar, gold and the S&P 500.
Author  Suzie
17 hours ago
A 0.3% monthly core CPI print has lifted the market-implied probability of a 25bp Fed hike on 16 September to roughly 86.5% ~ 90%, which would be the first increase since July 2023. Here is the decision timeline, the pricing versus the forecasts, both scenarios, and the key levels for the dollar, gold and the S&P 500.
placeholder
Silver Price Forecast: XAG/USD falls to near $63.50 amid Fed hike bets, higher oil pricesSilver price (XAG/USD) loses its gains from the previous day, trading around $63.50 per troy ounce during Asian hours on Monday. Non-yielding Silver is currently facing significant headwinds driven by rising Federal Reserve (Fed) rate-hike expectations for the upcoming September decision.
Author  FXStreet
14 hours ago
Silver price (XAG/USD) loses its gains from the previous day, trading around $63.50 per troy ounce during Asian hours on Monday. Non-yielding Silver is currently facing significant headwinds driven by rising Federal Reserve (Fed) rate-hike expectations for the upcoming September decision.
goTop
quote