


Solana (SOLUSD) Suddenly Goes down 1.06% on Sep 10: What You Need to Watch
Solana (SOLUSD) is down 1.06% at Sep 10 02:20(ET), now at $100.5, with a 7-day down of 3.28%.
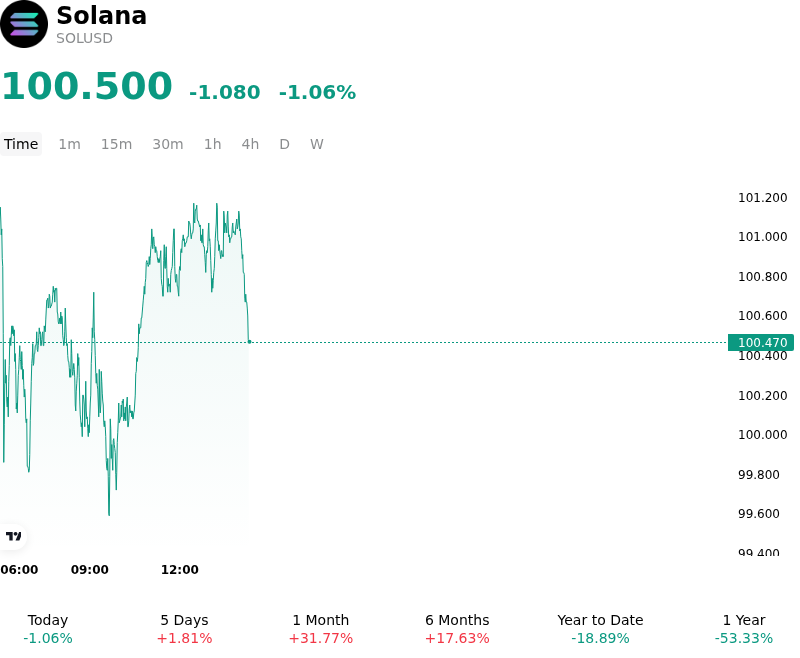
What is driving Solana (SOLUSD)’s stock price down today?
Solana experienced a modest pullback during intraday trading as broader crypto market conditions reflected a phase of short-term consolidation and tactical profit-taking near key overhead resistance levels. While medium-term technical structures remain intact, short-term momentum softened as leveraged long positions were trimmed following recent price advances. The retreat aligns with broader cooling across high-beta digital assets, where institutional market participants adjusted short-term exposure ahead of key macroeconomic policy signals and global liquidity updates.
Fundamental developments across the Solana ecosystem remain structurally constructive, underscored by ongoing core network infrastructure upgrades designed to expand transaction execution capacity and efficiency. The recent mainnet activation of the expanded transaction payload format improves processing capabilities for complex smart contracts, zero-knowledge proofs, and cross-chain interoperability. However, crypto asset markets frequently display sell-the-news dynamics, as foundational technical enhancements require time to translate into measurable increases in decentralized application activity, fee capture, and sustained spot demand.
From a market structure perspective, capital flows suggest that institutional investors are maintaining a disciplined stance, balancing longer-term adoption narratives against near-term macro uncertainties. Derivatives positioning points to a minor contraction in open interest and a stabilization in funding rates, indicating a routine flush of short-term speculative leverage rather than aggressive institutional distribution. Meanwhile, lingering expectations around potential spot ETF developments and rising decentralized exchange volume continue to provide underlying support, capping downside pressure during intraday corrections.
Investors continue to monitor broader global liquidity trends, Treasury yield movements, and risk-appetite shifts across global markets for directional cues. Within the Solana ecosystem, key metrics such as validator health, network throughput execution, and developer retention will remain central in evaluating whether the recent price consolidation represents a temporary pause before further expansion or portends a broader period of range-bound trading.
Technical Analysis of Solana (SOLUSD)
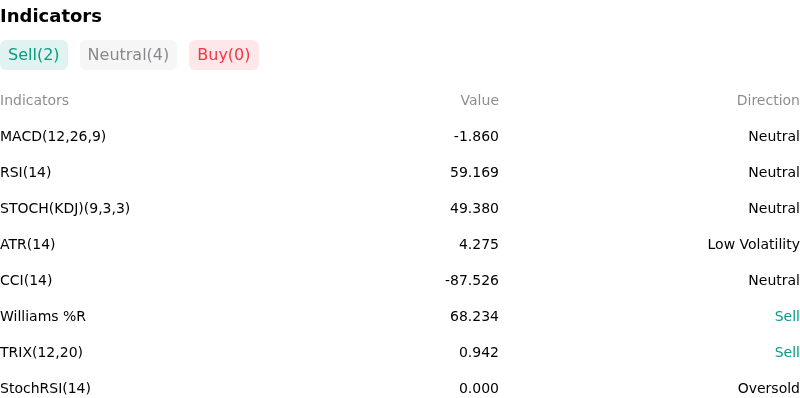
Technically, Solana (SOLUSD) shows a MACD (12,26,9) value of -1.860, indicating a neutral signal. The RSI at 59.169 suggests neutral condition and the Williams %R at 68.234 suggests sell condition. Please monitor closely.
More details about Solana (SOLUSD)
Recent Events and Risks:
- Derivatives Unwinding and Negative Funding Rates: Solana futures metrics have turned predominantly bearish with funding rates flipping negative and the long/short account ratio slipping to 0.92, while dense downside liquidation clusters between $100 and $103 threaten to trigger cascading long squeezes if key psychological support fails.
- Technical Resistance Rejection and Momentum Decay: SOL experienced repeated rejections at the $106.80–$108.50 overhead resistance band, causing daily MACD momentum indicators to flip negative and derivatives trading volume to decline 16%, exposing the asset to a deeper corrective drop toward lower support levels around $94.80 to $98.
- Deceleration in Spot ETF Inflows and Macro Yield Headwinds: Institutional demand for spot Solana ETF products slowed noticeably following late August, reducing marginal buy-side absorption against overhead supply, while elevated U.S. Treasury yields and a resilient U.S. dollar continue to suppress speculative risk appetite across high-beta smart contract platforms.
- Institutional Treasury Reallocations and Altcoin Offloading: Corporate treasury shifts, including disclosures of treasury firms like Remixpoint completely liquidating their SOL holdings to consolidate exclusively into Bitcoin, underscore growing institutional supply overhang and capital rotation out of major Layer-1 altcoins.
Recommended Articles


