


Caseys General Stores Inc Stock (CASY) Moved Down by 15.56% on Sep 9: Drivers Behind the Movement
Caseys General Stores Inc (CASY) moved down by 15.56%. The Food & Drug Retailing sector is down by 0.43%. The company underperformed the industry. Top 3 stocks by turnover in the sector: Walmart Inc (WMT) down 0.07%; Caseys General Stores Inc (CASY) down 15.56%; Sysco Corp (SYY) up 3.16%.
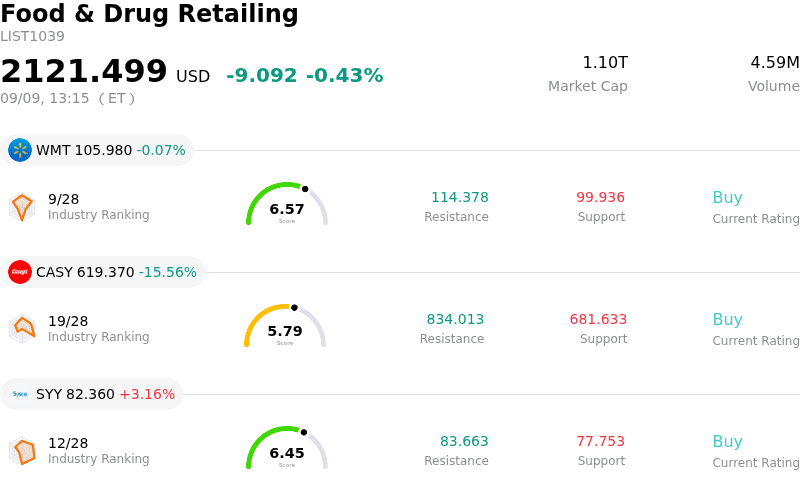
What is driving Caseys General Stores Inc (CASY)’s stock price down today?
Casey's General Stores experienced a sharp downward revaluation following the release of its first-quarter fiscal 2027 financial results. Although the convenience-store operator delivered headline beats on both top-line revenue and diluted earnings per share, institutional investors focused intensely on the composition of those profits, near-term cash flow metrics, and the lack of an upward revision to full-year guidance.
A primary catalyst for the decline was concern over the quality and sustainability of the quarterly beat. A substantial portion of the profitability outperformance stemmed from favorable fuel margin expansion rather than organic volume gains. Same-store fuel gallons sold experienced a minor contraction, indicating that fuel profit gains were heavily reliant on favorable wholesale-to-retail price spreads. Because fuel margins are inherently volatile and subject to commodity price fluctuations, market participants generally assign lower valuation multiples to fuel-driven profit upside compared to recurring retail merchandise earnings. Meanwhile, inside same-store sales growth decelerated from prior-year levels, underperforming elevated street expectations for core retail momentum.
Investor sentiment was further dampened by management’s decision to reiterate, rather than raise, its full-year fiscal 2027 operational outlook. Given the magnitude of the quarterly earnings beat, the market had largely priced in a guidance upgrade. The conservative stance suggested potential cost pressures or margin normalization in upcoming quarters. Simultaneously, free cash flow declined year-over-year due to elevated capital expenditures directed toward new store builds and integration costs. Coming off a sustained rally that had elevated the stock's valuation, the combination of decelerating core retail trends, lower free cash generation, and a static full-year target triggered significant profit-taking across institutional portfolios.
Technical Analysis of Caseys General Stores Inc (CASY)
Technically, Caseys General Stores Inc (CASY) shows a MACD (12,26,9) value of -29.641, indicating a sell signal. The RSI at 19.295 suggests oversold condition and the Williams %R at 91.351 suggests oversold condition. Please monitor closely.
Media Coverage of Caseys General Stores Inc (CASY)
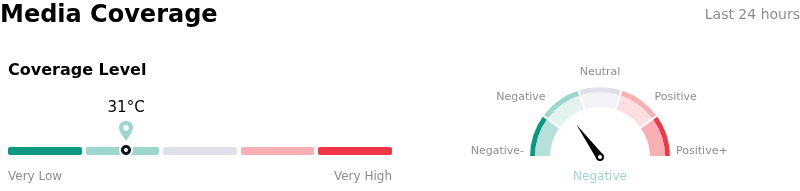
In terms of media coverage, Caseys General Stores Inc (CASY) shows a coverage score of 31, indicating a low level of media attention. The overall market sentiment index is currently in bearish zone.
Fundamental Analysis of Caseys General Stores Inc (CASY)
Caseys General Stores Inc (CASY) is in the Food & Drug Retailing industry. Its latest annual revenue is $17.56B, ranking 10 in the industry. The net profit is $714.45M, ranking 5 in the industry. Company Profile
Over the past month, multiple analysts have rated the company as Buy, with an average price target of $944.12, a high of $1069.00, and a low of $795.00.
More details about Caseys General Stores Inc (CASY)
Company Specific Risks:
- Conservative Outlook and Reaffirmed Full-Year Guidance: Despite exceeding Q1 fiscal 2027 top- and bottom-line estimates, management maintained its full-year guidance unchanged, disappointing institutional investors who expected an upward revision and triggering fears of decelerating growth momentum.
- Unbalanced Profit Growth Dependent on Volatile Fuel Margins: First-quarter earnings outperformance was heavily driven by a temporary surge in fuel gross margins to 47.8 cents per gallon from 41.0 cents a year ago, while same-store fuel gallons sold declined by 0.3%, highlighting a vulnerability to volatile wholesale pricing spreads rather than organic volume expansion.
- Free Cash Flow Compression from High Capital Intensity: Quarterly free cash flow dropped significantly to $190 million from $262 million in the prior-year period due to elevated capital expenditures for store network expansion and integration remodels, straining cash conversion.
- Accelerating Operating Expense Inflation: Total operating expenses expanded 8% year-over-year to $754.1 million, pressured by higher same-store hourly labor rates, increased credit card interchange fees, and rising corporate insurance costs.
Recommended Articles


