


BNB (BNBUSD) Is down 1.04% on Sep 7: Key Drivers to Watch
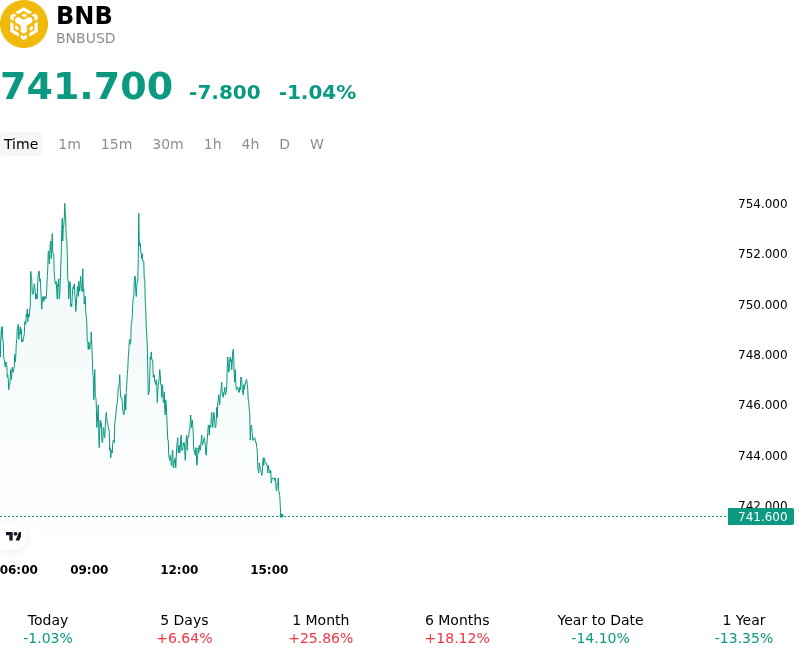
BNB (BNBUSD) is down 1.04% at Sep 7 03:25(ET), now at $741.7, with a 7-day up of 7.60%.
What is driving BNB (BNBUSD)’s stock price down today?
The modest intraday decline in BNBUSD primarily reflects short-term profit-taking and a necessary cooling period following a sharp momentum-driven breakout above critical technical resistance levels. After surging past key psychological barriers in recent sessions, overbought conditions on lower-timeframe momentum indicators prompted institutional and derivative traders to reduce long exposure and lock in gains. The pullback was further amplified by a mild deleveraging in the perpetual swap markets, where funding rates normalized as speculative leverage unwound.
From a broader liquidity and structural perspective, the modest pullback represents a healthy consolidation within an ongoing macro repricing rather than a fundamental shift in sentiment. On-chain metrics across the BNB Chain ecosystem continue to exhibit steady baseline activity, reinforced by infrastructure upgrades, expanding daily active user engagement, and ongoing supply-side reductions via scheduled token burn mechanisms. However, in the absence of fresh macro or exchange-specific catalysts, spot buying absorbed the elevated selling pressure around short-term support levels without sparking aggressive dip-buying.
Market participants remain focused on global liquidity conditions, Federal Reserve policy expectations, and macroeconomic risk sentiment, which govern capital allocation across high-beta digital assets. For institutional investors, key considerations include the sustainability of spot exchange volumes, derivative open interest dynamics, and the network's ability to maintain user retention and institutional real-world asset integrations. Near-term price action will likely depend on whether spot demand can defend previous resistance-turned-support zones while leverage positioning stabilizes across major derivatives venues.
Technical Analysis of BNB (BNBUSD)
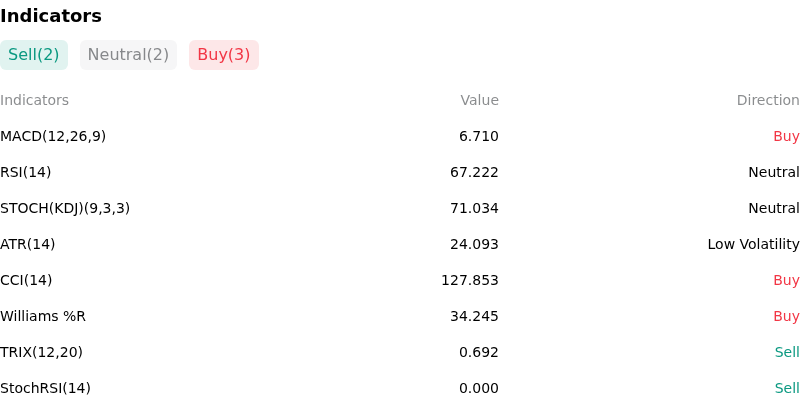
Technically, BNB (BNBUSD) shows a MACD (12,26,9) value of 6.710, indicating a buy signal. The RSI at 67.222 suggests neutral condition and the Williams %R at 34.245 suggests buy condition. Please monitor closely.
More details about BNB (BNBUSD)
Recent Events and Risks:
- Regulatory Scrutiny and Licensing Uncertainty: Persistent regulatory scrutiny surrounding Binance's compliance and operational licensing across major international markets continues to create headline risk, threatening regional exchange accessibility and depressing institutional liquidity for BNB.
- Validator Centralization and Governance Vulnerabilities: On-chain analysis shows that block production on the BNB Smart Chain remains highly concentrated among a small pool of active validators, exacerbating concerns over network decentralization, MEV extraction, and censorship vulnerability during periods of high network congestion.
- Concentrated Token Ownership and Reserve Exposure: A vast majority of circulating BNB is held or custodied within the central Binance exchange ecosystem, leaving the asset uniquely exposed to sharp price drawdowns triggered by exchange treasury rebalancing, major holder profit-taking, or sudden ecosystem liability adjustments.
- Derivatives Unwinding and Key Support Breaches: Technical consolidation near lower support levels around $730–$750 leaves BNB vulnerable to cascading long liquidations and leverage unwinds if macro digital asset sentiment turns risk-off.
Recommended Articles


