


USD/CHF (USDCHF) Drops 0.54% on Sep 3: What Does the Market Value?
USD/CHF (USDCHF) is down 0.54% at Sep 3 03:10(ET), now at $0.80839, with a 7-day up of 0.55%.
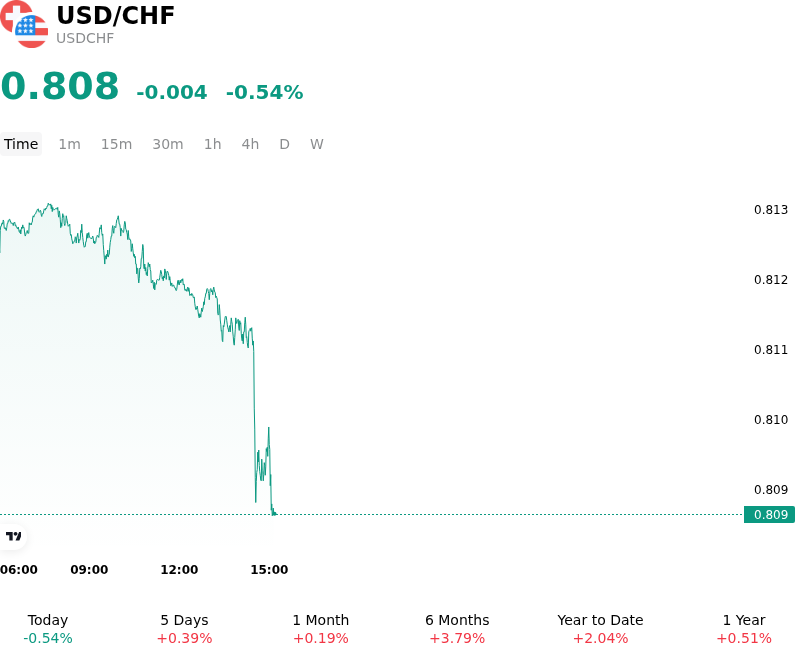
What is driving USD/CHF (USDCHF)’s stock price down today?
The decline in USDCHF was primarily driven by a domestic inflation surprise in Switzerland, which prompted a swift repricing of Swiss National Bank policy expectations and fueled demand for the Swiss franc relative to the U.S. dollar. August CPI data showed headline inflation accelerating to 0.8% year-over-year, comfortably exceeding market expectations for a 0.5% gain and marking its highest reading in two years. The unexpected pickup in price pressures, driven by higher petroleum costs and rising import prices, dampened market speculation regarding potential sub-zero interest rate cuts by the SNB ahead of its monetary policy decision. As dovish expectations receded, short-term rate expectations shifted in favor of the franc, prompting institutional accounts to build CHF long exposure.
Compounding the strength of the Swiss franc was a broader pullback in the U.S. dollar as yield dynamics stabilized following a multi-week rally. Investors adjusted exposure and engaged in profit-taking ahead of critical U.S. macroeconomic releases, most notably the upcoming non-farm payrolls report. U.S. Treasury yields eased slightly across the front end of the curve, softening short-term yield support for the greenback. The unwinding of stretched long dollar positions against lower-yielding peers contributed to downside pressure on USDCHF, as market participants reassessed the pace and trajectory of Federal Reserve monetary policy easing.
Technical factors and institutional capital flows also played a key role in accelerating the currency pair's downward trajectory. USDCHF encountered strong technical resistance near the 0.8130 to 0.8150 pivot zone, representing a key technical resistance level and multi-week high. Failure to clear this barrier triggered automated stop-loss orders and profit-taking from tactical long positions. Additionally, subtle shifts in global risk sentiment increased allocation toward safe-haven assets, with the Swiss franc benefiting from its traditional status as a high-quality reserve currency during periods of macro uncertainty.
Technical Analysis of USD/CHF (USDCHF)
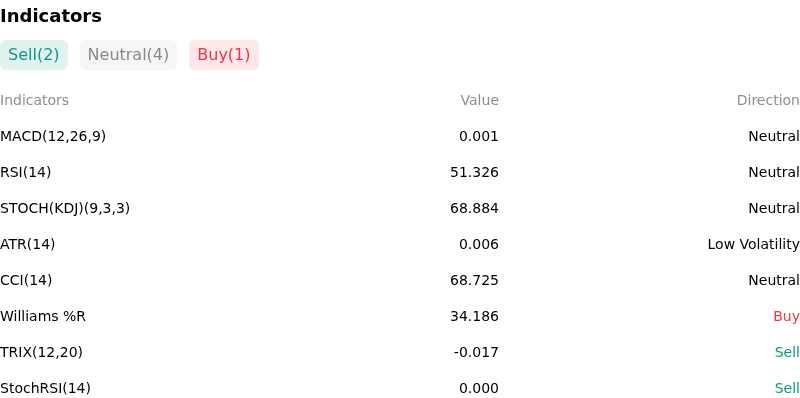
Technically, USD/CHF (USDCHF) shows a MACD (12,26,9) value of 0.001, indicating a neutral signal. The RSI at 51.326 suggests neutral condition and the Williams %R at 34.186 suggests buy condition. Please monitor closely.
More details about USD/CHF (USDCHF)
Recent Events and Risks:
- Hotter-Than-Expected Swiss Inflation Surge: Switzerland's August CPI unexpectedly accelerated to 0.8% year-on-year (beating the 0.5% consensus) and 0.4% month-on-month, driven by higher energy and rental costs. This inflation surprise dampens prospects for further Swiss National Bank dovish guidance, triggering fresh Swiss Franc buying and creating immediate downside risk for USD/CHF.
- Geopolitical Escalation and Safe-Haven CHF Inflows: Escalating military tensions in the Middle East and surrounding energy market volatility have intensified global risk aversion. Capital flows seeking safe-haven shelter favor the Swiss Franc due to Switzerland's current account stability and political neutrality, exerting strong intraday selling pressure on USD/CHF.
- U.S. Labor Market Softening and Yield Compression Risk: Softness in recent U.S. JOLTS job openings demonstrated persistent hiring sluggishness ahead of upcoming Nonfarm Payrolls. Any downside surprise in employment or wage growth threatens to rapidly reprice Fed rate expectations downward and compress Treasury yields, leaving the U.S. Dollar vulnerable to sharp pullbacks against CHF.
- Technical Resistance Rejection and Profit-Taking Pressure: USD/CHF's multi-week rally stalled near the critical 0.8130–0.8150 resistance barrier, where overbought momentum indicators and emerging negative divergences signal buyer exhaustion. Failure to decisively break higher increases the risk of long liquidation and technical unwinding toward lower support around 0.8080.
Recommended Articles


