


XRP (XRPUSD) Suddenly Goes down 1.01% on Sep 2: What's Driving This
XRP (XRPUSD) is down 1.01% at Sep 2 04:30(ET), now at $1.3405, with a 7-day down of 2.80%.
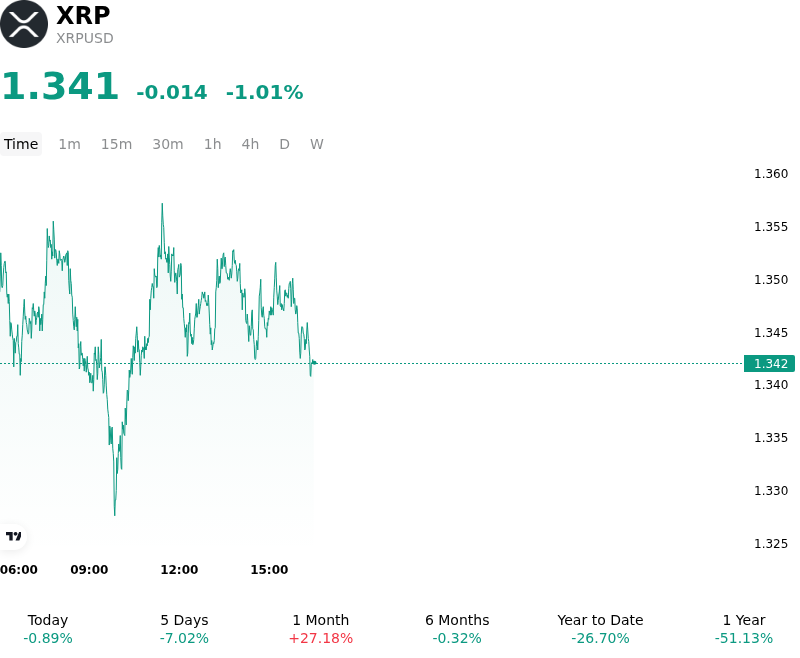
What is driving XRP (XRPUSD)’s stock price down today?
XRP experienced modest downward pressure as market participants digested short-term supply dynamics and engaged in profit-taking following a powerful multi-week advance. The primary near-term supply catalyst was Ripple's standard monthly unlock of 1 billion XRP from escrow at the start of September. Although Ripple historically returns 60 to 80 percent of released tokens back into new time-locked escrow contracts, the initial unlock creates an immediate requirement for market liquidity absorption. Coming on the back of a strong August rally, this routine supply event prompted short-term traders to realize gains near key overhead technical resistance levels, temporarily weakening buying momentum.
Institutional interest through spot XRP exchange-traded products continues to serve as a pivotal structural anchor, even as daily capital flows temporarily moderated. Cumulative net inflows into spot XRP ETFs reached record levels, demonstrating strong underlying demand from institutional asset managers and treasury desks. However, short-term liquidity conditions tightened slightly as institutional allocators adopted a wait-and-see stance ahead of upcoming macroeconomic signals. Broader digital-asset sentiment remains sensitive to Federal Reserve interest rate policy expectations and impending legislative decisions regarding U.S. regulatory frameworks, encouraging tactical risk reduction among macro-driven market participants.
Derivatives market positioning further amplified the intraday volatility. A momentum cooldown across short-timeframe technical indicators, including negative MACD readings and relative strength index compression, triggered selective long liquidations across major derivatives venues. The flushing of leveraged positions accelerated the mild pullback into key demand zones. Despite this short-term retracement, the move appears to reflect an event-driven consolidation and liquidity repricing rather than a broader structural deterioration. Investors continue to track post-unlock re-escrow data, spot ETF flow continuity, and macroeconomic liquidity trends as key determinants for the next directional leg.
Technical Analysis of XRP (XRPUSD)
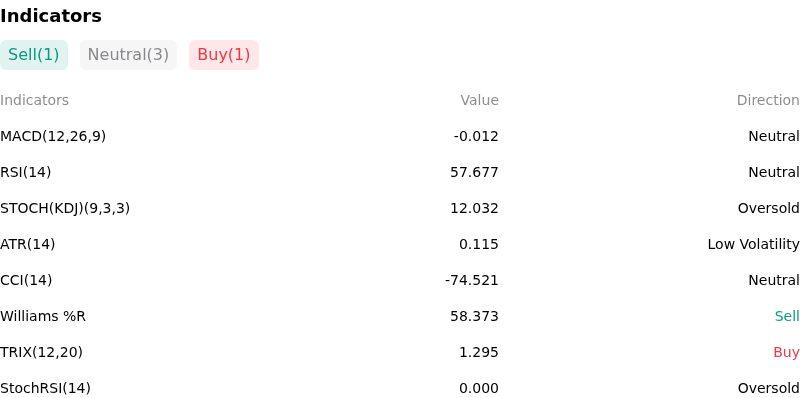
Technically, XRP (XRPUSD) shows a MACD (12,26,9) value of -0.012, indicating a neutral signal. The RSI at 57.677 suggests neutral condition and the Williams %R at 58.373 suggests sell condition. Please monitor closely.
More details about XRP (XRPUSD)
Recent Events and Risks:
- Monthly Escrow Token Unlock Pressure: Ripple released 1 billion XRP from its escrow contracts on September 1, trimming locked reserves to 31.28 billion tokens. The expected net addition of 200 million to 400 million XRP into circulating supply introduces $270 million to $550 million in structural sell pressure, significantly outpacing daily spot ETF absorption capacity.
- Derivatives Over-Leverage and Long Liquidation Risk: A heavy buildup in futures open interest and elevated leverage ratios across exchanges recently drove Binance net taker volume down to -$96 million, marking intense derivatives selling pressure. Consecutive long position liquidations threaten to force prices through key technical support around $1.34–$1.35.
- XRPL Fee Capture Disconnect: On-chain data shows an 81.6% drop in XRP Ledger transaction fee revenue down to $1.18 million, despite elevated transaction settlement volumes. Because transaction fees remain minimal, token burn rates are too negligible to offset 5.5% annual escrow supply dilution or capture real value for XRP holders.
- Legislative Momentum Delays and Macro Yield Sensitivity: The postponement of the U.S. CLARITY Act to upcoming Senate procedural votes has delayed key regulatory classification catalysts. Concurrently, macro traders warn that any rebound in long-end U.S. Treasury yields threatens to reverse the liquidity tailwinds that funded August's altcoin market rebound.
Recommended Articles


