


Lam Research Corp Stock (LRCX) Moved Down by 3.84% on Aug 28: Drivers Behind the Movement
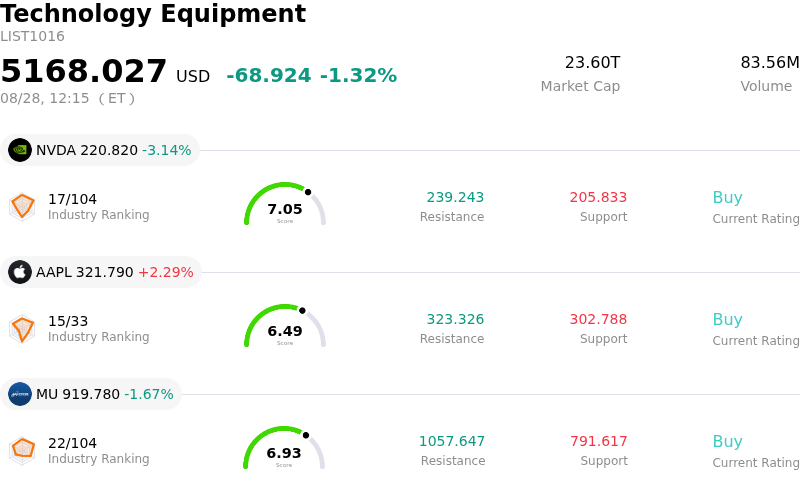
Lam Research Corp (LRCX) moved down by 3.84%. The Technology Equipment sector is down by 1.32%. The company underperformed the industry. Top 3 stocks by turnover in the sector: NVIDIA Corp (NVDA) down 3.14%; Apple Inc (AAPL) up 2.15%; Micron Technology Inc (MU) down 1.75%.
What is driving Lam Research Corp (LRCX)’s stock price down today?
The decline in Lam Research shares was driven primarily by broader profit-taking across the semiconductor equipment sector following a multi-week rally powered by artificial intelligence infrastructure momentum. With high-beta wafer fabrication equipment stocks trading near rich valuation multiples, short-term macroeconomic caution and institutional portfolio rebalancing triggered sell-offs across the semiconductor capital equipment cohort. Market sentiment across tech supply chains experienced a temporary risk-off shift, causing investors to lock in recent gains despite an encouraging multi-year spending forecast for global semiconductor fabrication capacity.
The pullback occurred against a backdrop of constructive corporate developments and strong capital allocation signals from management. Lam Research recently announced a significant increase to its quarterly cash dividend, demonstrating leadership confidence in long-term earnings durability and recurring cash flow generation from its growing installed equipment base. Furthermore, the company broke ground on a major research and development lab expansion in Oregon, reflecting its long-term strategy to invest heavily in advancing atomic-scale deposition and etching technologies required for next-generation AI processors and high-bandwidth memory.
From an institutional perspective, the pull-back represents sector-level volatility rather than a deterioration in company-specific fundamentals. Fundamental drivers remain anchored in leading-edge foundry capex, memory market recovery, and sustained demand for advanced chip architecture. Long-term investors continue to monitor global wafer fabrication equipment spending trends, customer capital expenditure budgets, and execution on capacity expansions to gauge future order momentum as the broader semiconductor cycle progresses.
Technical Analysis of Lam Research Corp (LRCX)
Technically, Lam Research Corp (LRCX) shows a MACD (12,26,9) value of -0.173, indicating a sell signal. The RSI at 45.716 suggests neutral condition and the Williams %R at 82.947 suggests oversold condition. Please monitor closely.
Media Coverage of Lam Research Corp (LRCX)
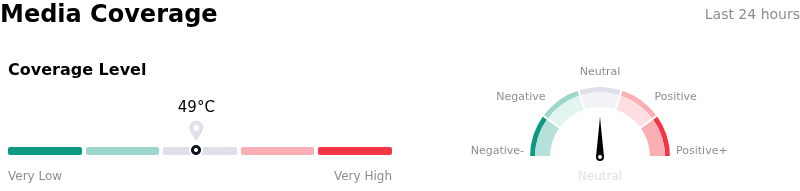
In terms of media coverage, Lam Research Corp (LRCX) shows a coverage score of 49, indicating a moderate level of media attention. The overall market sentiment index is currently in neutral zone.
Fundamental Analysis of Lam Research Corp (LRCX)
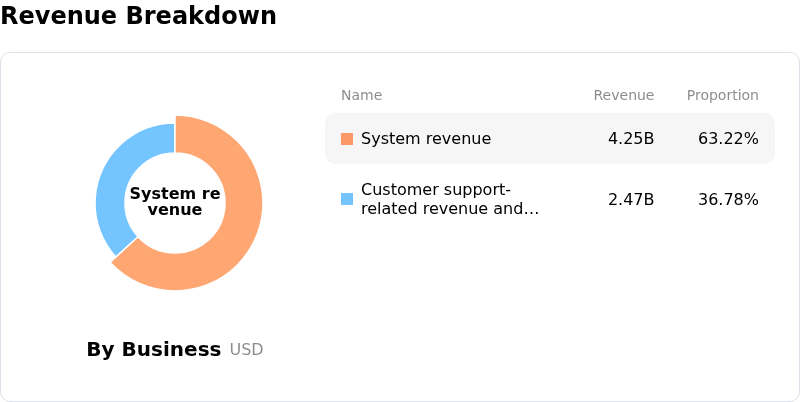
Lam Research Corp (LRCX) is in the Technology Equipment industry. Its latest annual revenue is $23.23B, ranking 12 in the industry. The net profit is $7.27B, ranking 7 in the industry. Company Profile
Over the past month, multiple analysts have rated the company as Buy, with an average price target of $366.22, a high of $500.00, and a low of $213.00.
More details about Lam Research Corp (LRCX)
Company Specific Risks:
- Geopolitical Export Controls and China Concentration: Strict U.S. export restrictions and rapid domestic Chinese equipment substitution directly threaten Lam's high revenue exposure to Chinese wafer fabrication equipment buyers.
- Elevated Valuation and De-Risking Exposure: Trading at an elevated valuation multiple exceeding 50x earnings alongside ongoing insider share sales, the stock is highly susceptible to sudden pullbacks and profit-taking during sector-wide tech de-risking events.
- Customer Capex Reallocation to AI-Logic: Key foundry and memory customers are shifting capital expenditures toward AI-logic hardware, leading to spending volatility and channel inventory digestion risks for Lam's core NAND and DRAM etching and deposition tools.
- Heavy Capital Expenditures Amid Cyclical Shift: Substantial multi-billion-dollar commitments to expand global R&D lab infrastructure increase operational overhead and fixed cost burdens if semiconductor equipment demand encounters a cyclical slowdown.
Recommended Articles


