


Solana (SOLUSD) Suddenly Goes down 1.08% on Aug 23: What You Need to Watch
Solana (SOLUSD) is down 1.08% at Aug 23 00:10(ET), now at $92.38, with a 7-day up of 24.77%.
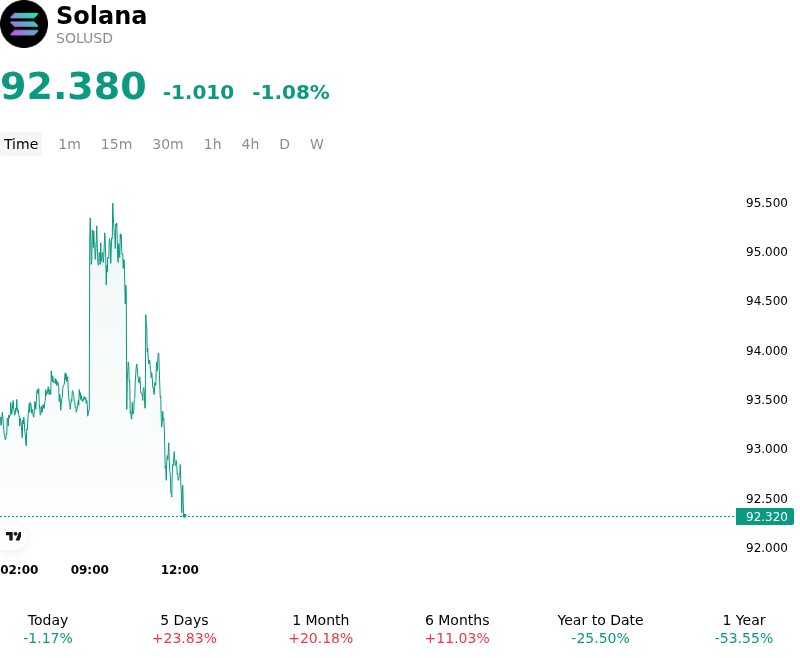
What is driving Solana (SOLUSD)’s stock price down today?
Solana experienced downside pressure as market participants engaged in profit-taking following a powerful multi-session surge toward key technical resistance levels. The pullback was primarily driven by intraday leverage unwinding and tactical position rebalancing across crypto derivatives venues, where heavily leveraged long positions faced liquidation following an extended rally. Momentum indicators on short-term timeframes had reached overbought territory, prompting systematic risk managers and algorithmic traders to scale back risk exposure.
The broader market context contributed to the softening, as major digital assets underwent a temporary consolidation and liquidity flush. A deleveraging event across centralized crypto exchanges triggered forced liquidations in perpetual futures contracts, reducing market-wide open interest and temporarily curtailing speculative liquidity. While global macro conditions remained supportive following recent Treasury debt buyback operations and lower sovereign yields, the brief absence of fresh buy-side catalysts allowed market makers to pull back bid depth, resulting in moderate price drift.
Despite the temporary retracement, structural drivers for Solana remain constructve. Sustained capital commitment to spot Solana exchange-traded products continues to signal steady institutional demand, while recent protocol optimizations, such as the Agave upgrade, continue to lower network state fees and enhance transaction throughput. Overall, the move reflects a localized leverage shakeout and profit-taking event rather than a fundamental shift in network adoption or long-term ecosystem sentiment.
Technical Analysis of Solana (SOLUSD)
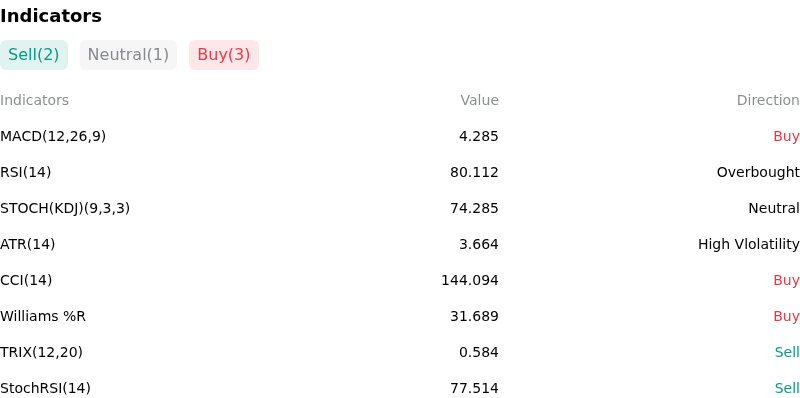
Technically, Solana (SOLUSD) shows a MACD (12,26,9) value of 4.285, indicating a buy signal. The RSI at 80.112 suggests overbought condition and the Williams %R at 31.689 suggests buy condition. Please monitor closely.
More details about Solana (SOLUSD)
Recent Events and Risks:
- Derivative Liquidation Cascades and Intraday Flash Volatility: Following a rapid rally toward $94, SOL experienced an 11.5% intraday drop in a five-minute window down to $88.08. The sharp pullback highlighted heavy leverage build-up in perpetual futures contracts, where localized liquidation cascades and sudden whale sell orders quickly unwound speculative positions.
- Institutional Friction Over On-Chain Governance Proposals: On-chain voting opened on August 22 for three inaugural Solana Governance Proposals (SGP-0001 through SGP-0003) covering token issuance and fee structures. Major institutional participants, including Nasdaq-listed Solana Company, announced opposition to SGP-0002 and SGP-0003 due to concerns that faster disinflation and variable fee changes would negatively impact validator staking yields and institutional adoption.
- Technical Rejection and Overbought RSI Conditions: SOL's daily Relative Strength Index (RSI) crossed above 81 into overbought territory, coinciding with a strict rejection at the $94–$96 resistance ceiling that has capped recovery attempts throughout 2026. Failure to consolidate above this barrier increases the near-term probability of deeper pullbacks toward downside liquidity clusters at $85–$88.
- Declining Network Revenue and Fee Contraction: Recent on-chain data indicates that Solana's second-quarter network fees fell 44% quarter-over-quarter to approximately $50 million—a steep drop from historical peaks near $900 million. Fading memecoin activity and lower MEV tips leave the network with subdued organic fee generation, making current price levels more reliant on derivatives positioning than spot demand.
Recommended Articles


