


Goldman Sachs Group Inc Stock (GS) Moved Up by 3.73% on Aug 21: Facts Behind the Movement
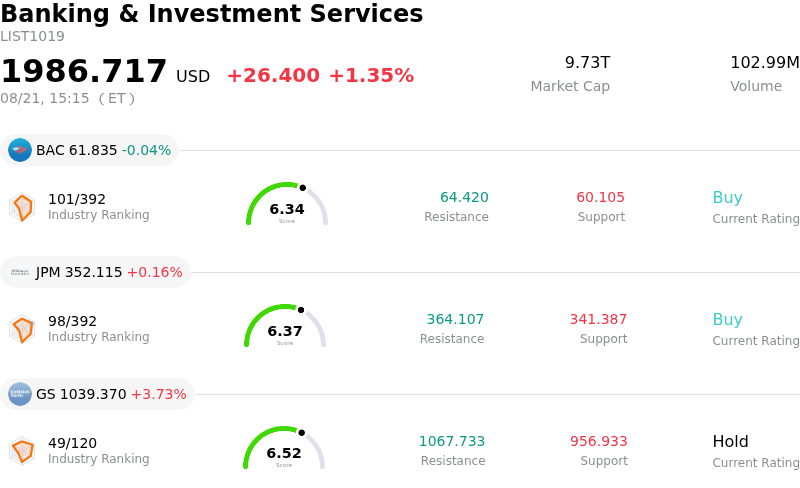
Goldman Sachs Group Inc (GS) moved up by 3.73%. The Banking & Investment Services sector is up by 1.35%. The company outperformed the industry. Top 3 stocks by turnover in the sector: Bank of America Corp (BAC) down 0.04%; JPMorgan Chase & Co (JPM) up 0.16%; Goldman Sachs Group Inc (GS) up 3.73%.
What is driving Goldman Sachs Group Inc (GS)’s stock price up today?
The upward trajectory in Goldman Sachs share price reflects strengthening momentum across its core investment banking and capital markets operations. Recent transaction activity underscores the firm's expanding fee pipeline, highlighted by major global advisory roles in emerging market government share sales and high-profile technology initial public offerings. As dealmaking continues to recover from prior lulls, Goldman Sachs maintains a dominant competitive position in equity capital markets and cross-border advisory. This sustained resurgence in capital markets activity provides a solid catalyst for top-line revenue growth and supports positive earnings momentum.
Intraday trading dynamics were further amplified by macroeconomic policy expectations and fixed-income market fluctuations. With interest rate expectations undergoing recalibration ahead of major central bank policy symposiums, elevated volatility in Treasury yields and cross-asset markets directly benefits the firm's market-making operations. As one of the premier global liquidity providers, Goldman Sachs is well-positioned to capture heightened institutional trading volumes and client hedging activity during periods of rate uncertainty and portfolio repositioning.
From a market sentiment perspective, institutional portfolio disclosures indicate ongoing strategic allocations into diversified money-center banks and capital market leaders. While macroeconomic sentiment remains cautious due to shifting monetary policy trajectories, investor interest in key financial bellwethers highlights a preference for firms with strong fee-generation capabilities and asset management franchises. Consequently, robust trading revenue expectations combined with a recovering advisory backlog continue to drive positive stock momentum.
Technical Analysis of Goldman Sachs Group Inc (GS)
Technically, Goldman Sachs Group Inc (GS) shows a MACD (12,26,9) value of -2.552, indicating a sell signal. The RSI at 49.890 suggests neutral condition and the Williams %R at 50.033 suggests neutral condition. Please monitor closely.
Media Coverage of Goldman Sachs Group Inc (GS)
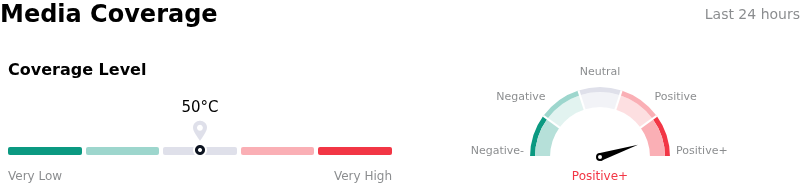
In terms of media coverage, Goldman Sachs Group Inc (GS) shows a coverage score of 50, indicating a moderate level of media attention. The overall market sentiment index is currently in extremely bullish zone.
Fundamental Analysis of Goldman Sachs Group Inc (GS)
Goldman Sachs Group Inc (GS) is in the Banking & Investment Services industry. Its latest annual revenue is $117.10B, ranking 2 in the industry. The net profit is $16.30B, ranking 1 in the industry. Company Profile
Over the past month, multiple analysts have rated the company as Hold, with an average price target of $1174.89, a high of $1325.00, and a low of $995.00.
More details about Goldman Sachs Group Inc (GS)
Company Specific Risks:
- Prime Brokerage Exposure to Quant Fund Deleveraging: Market commentary from Goldman Sachs' prime brokerage desk highlighted a 1.4% single-day loss among systematic long-short managers and a near 7% drop in the firm's U.S. momentum factor over 48 hours, exposing the bank's trading desk to heightened counterparty risk and volatility during market-wide quantitative unwinds.
- Increased Preferred Capital Refinancing Costs: Recent SEC Form 8-K filings confirm the full redemption of Goldman's 3.65% Series U preferred stock replaced by 6.500% Series AA preferred stock, nearly doubling the dividend payout rate for this tier of preferred equity and elevating ongoing capital funding expenses.
- Stretched Valuation Multiples and Institutional Trimming: Shares are trading at a elevated Price-to-Sales (P/S) ratio of 4.69x, well above the historical median of 2.61x, making the equity vulnerable to intraday multiple compression while institutional tracking reports a net trimming trend among major asset managers.
- Macro Volatility Threats to Investment Banking Deal Flow: Research leadership warned that opaque Federal Reserve forward guidance will trigger erratic market volatility, creating an unstable financing environment that risks delaying client M&A execution and debt underwriting activity in Global Banking & Markets.
Recommended Articles


