


Solana (SOLUSD) Fluctuated Significantly on Aug 18: Key Variables Behind the Move
Solana (SOLUSD) is up 1.36% at Aug 18 10:30(ET), now at $76.01, with a 7-day up of 1.28%.
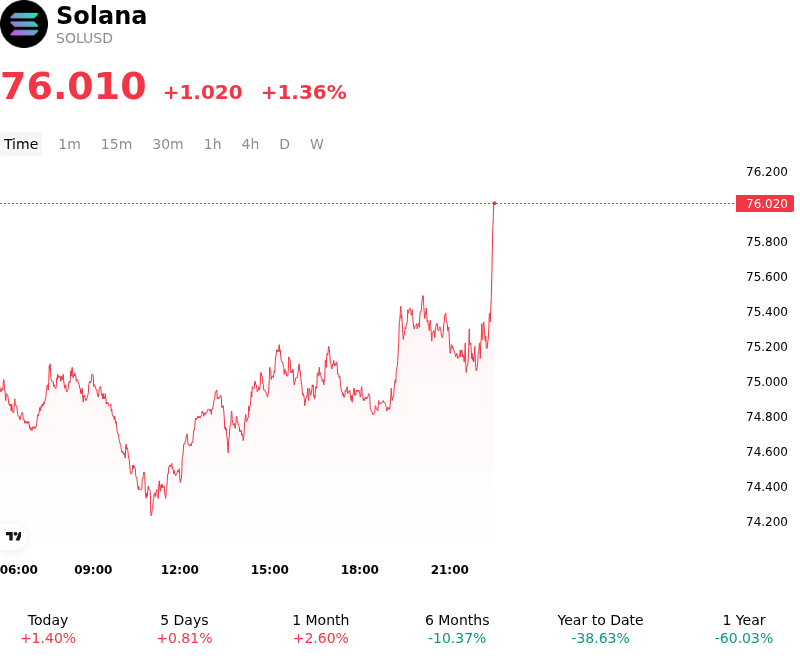
What is driving Solana (SOLUSD)’s stock price up today?
Solana advanced as renewed capital inflows were catalyzed by robust fundamental ecosystem metrics and momentum across decentralized finance protocols. On-chain performance data highlighted Solana regaining market leadership in decentralized exchange spot trading volume while simultaneously securing top position among smart contract platforms in monthly real-world asset net inflows. This concentration of liquidity and high-frequency trading activity boosted validator fee accumulation and structural demand for the native token as an essential execution asset across decentralized applications.
Investor sentiment was further bolstered by key protocol execution milestones surrounding validator deployment of the Agave client upgrade. The technical update introduces significant optimizations to on-chain state rent fees and block processing efficiency while setting the foundation for upcoming consensus overhauls aimed at compressing transaction finality times. Institutional market participants interpreted the smooth technical rollout as a positive signal for network scalability and enterprise adoption, prompting spot accumulation from long-term allocation desks.
Institutional positioning was reinforced by steady inflows into spot exchange-traded products and corporate treasury accumulation strategies. In the derivatives space, the move triggered a shift in market structure as price action breached key overhead technical barriers near major exponential moving averages. The resulting push forced momentum traders holding short positions to reduce leverage, generating a wave of buy-side short covering that amplified intraday upward momentum and deepened order book liquidity.
Despite the positive session, institutional investors continue to evaluate ongoing risk factors across the digital asset landscape. Market participants remain focused on global liquidity conditions and Federal Reserve interest rate trajectory, while monitoring regulatory developments surrounding proof-of-stake asset classifications and validator yields. Additionally, execution risks associated with major network consensus transitions and potential validator infrastructure concentration remain critical variables for long-term valuation models.
Technical Analysis of Solana (SOLUSD)
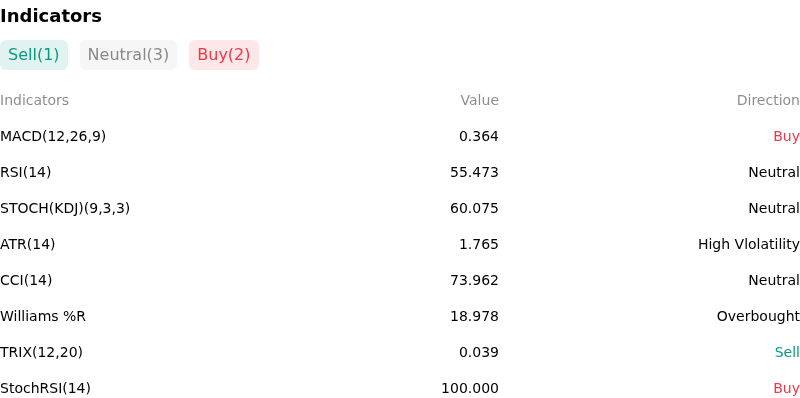
Technically, Solana (SOLUSD) shows a MACD (12,26,9) value of 0.364, indicating a buy signal. The RSI at 55.473 suggests neutral condition and the Williams %R at 18.978 suggests overbought condition. Please monitor closely.
More details about Solana (SOLUSD)
Recent Events and Risks:
- Validator Infrastructure Centralization and Finality Halt Risk: A major network routing glitch temporarily knocked 28.83% of total staked SOL offline across roughly 90 validators, pushing Solana within 4.5 percentage points of the 33.34% finality-halt threshold and revealing critical reliance on single infrastructure providers.
- Institutional Capital Outflows and ETF Stagnation: Demand for spot Solana ETFs has sharply decelerated with prolonged zero-net-flow trading sessions and weekly net outflows, accompanied by capital redemptions from leveraged Solana ETF products that highlight waning institutional risk tolerance.
- Derivatives Over-Leverage and Liquidation Cascade Vulnerability: Futures positioning remains heavily weighted toward long accounts relative to lower dollar open interest, creating high sensitivity to rapid long liquidation cascades if spot prices fail to defend immediate support in the $70 to $73 range.
- Whale Unwinding and Weak Spot Market Absorption: On-chain tracking highlights large holder position closures and sustained spot selling, leaving price action capped below overhead moving averages and risking a broader technical breakdown if spot accumulation fails to resume.
Recommended Articles


