


BNB (BNBUSD) Volatility Intensified on Jul 6: What You Should Know
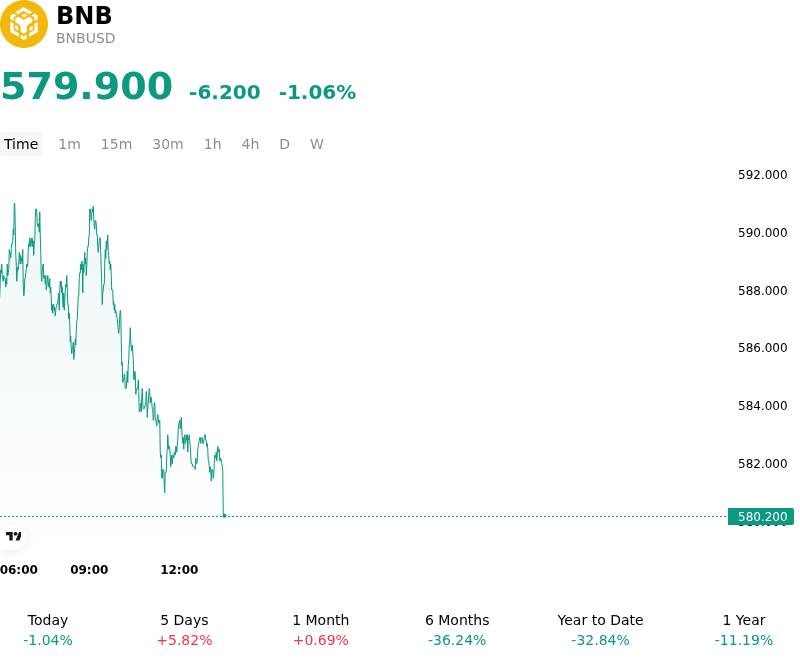
BNB (BNBUSD) is down 1.06% at Jul 6 01:30(ET), now at $579.9, with a 7-day up of 3.91%.
What is driving BNB (BNBUSD)’s stock price down today?
The intraday downward pressure on BNB reflects heightened caution among institutional and retail market participants, driven primarily by intensified regulatory enforcement and localized structural shifts. The foremost catalyst of this movement is the regulatory compliance shock associated with the European Union’s Markets in Crypto-Assets (MiCA) framework. Following the early July implementation deadline, major global exchanges, particularly Binance, have had to scale back or halt key services—including spot trading, deposits, and yield-bearing products—for EU residents due to localized licensing complexities. These regulatory adjustments have introduced localized selling pressure and limited access to exchange-related utility, weighing on short-term sentiment for the ecosystem’s native token.
This regulatory retreat is further evidenced by specific structural headwinds, such as the withdrawal of local license applications in European jurisdictions like Greece. Consequently, capital flows have reflected heightened risk aversion, characterized by the largest weekly outflows from the underlying exchange in nearly three years. As significant capital was withdrawn and transitioned to self-custody or competing networks, the reduction in localized liquidity amplified asset-specific volatility and restricted the immediate upward mobility of the token.
While the broader cryptocurrency market experienced a brief macro-driven relief rebound, fueled by softer U.S. labor data and subsequent dovish expectations for Federal Reserve monetary policy, the capital rotation did not heavily favor exchange-backed tokens. Instead, broader market liquidity remains fragmented. Although technical support for BNB was maintained by on-chain developments—including the deployment of the BNBAgent SDK to enhance developer activity on the BNB Chain—this utility narrative was overshadowed by near-term compliance uncertainties and spot market caution.
Additionally, derivatives market positioning suggests that leverage reduction and defensive spot hedging are tempering speculative momentum. Despite long-term institutional backstops, such as ongoing spot ETF filings from major asset managers, investors are maintaining a highly selective approach, monitoring ongoing capital outflows and global regulatory alignment before re-establishing aggressive exposure.
Technical Analysis of BNB (BNBUSD)
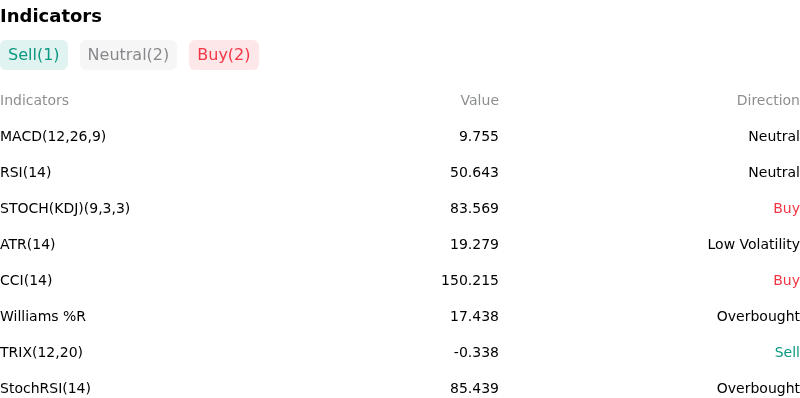
Technically, BNB (BNBUSD) shows a MACD (12,26,9) value of 9.755, indicating a neutral signal. The RSI at 50.643 suggests neutral condition and the Williams %R at 17.438 suggests overbought condition. Please monitor closely.
More details about BNB (BNBUSD)
Recent Events and Risks:
- Regulatory Setback Under MiCA: Following the passing of the July 1, 2026 deadline for the EU’s Markets in Crypto-Assets (MiCA) regulation, Binance failed to secure authorization after its application in Greece fell through. The exchange has been forced to restrict and suspend critical services (including new registrations, deposits, spot orders, and Earn features) for users in key EU jurisdictions like France, Italy, Spain, and Poland, directly threatening ecosystem utility and putting downward pressure on BNB.
- Tightening Corporate and Compliance Monitoring: The price of BNB remains highly sensitive to Binance's corporate risk profile as it operates under a strict five-year DOJ settlement. Any compliance slip detected by the active quarterly monitor reviews could trigger the deferred prosecution agreement, exposing Binance to forced restructuring or escalating fines, which acts as a structural overhang on the token's market value.
- Key Moving Average Resistance and Technical Fragility: BNB is trading under technical stress near the $570 level, roughly 59% below its historic highs. Traders are closely monitoring the 200-day moving average ($570.17), where a sustained break below this floor risks triggering accelerated long liquidations and shifting the market structure into a deeper bearish drift toward the $500 support level.
- Market-Wide Liquidity and Risk-Off Sentiment: Persistent global macroeconomic pressures and capital rotation have pushed crypto market sentiment deep into "Extreme Fear" territory. This lack of risk appetite, paired with a low-volume environment, leaves BNB highly vulnerable to sharp downside swings and cascade liquidations from leveraged long positions whenever overall market liquidity thins.
Recommended Articles


