

Silver Price Forecast: XAG/USD bounces back above $36.00 as the Dollar plunges
- XAG/USD bounces off five-day low, forms bullish hammer as USD slides to 3-year trough
- Bullish hammer pattern suggests renewed upside momentum toward $36.88 and $37.49 — a 13-year high.
- RSI remains steady despite overbought conditions, signaling buyers are still in control.
- Key support lies at $36.00 and $35.40; a break below would open the door to $35.00 and lower.
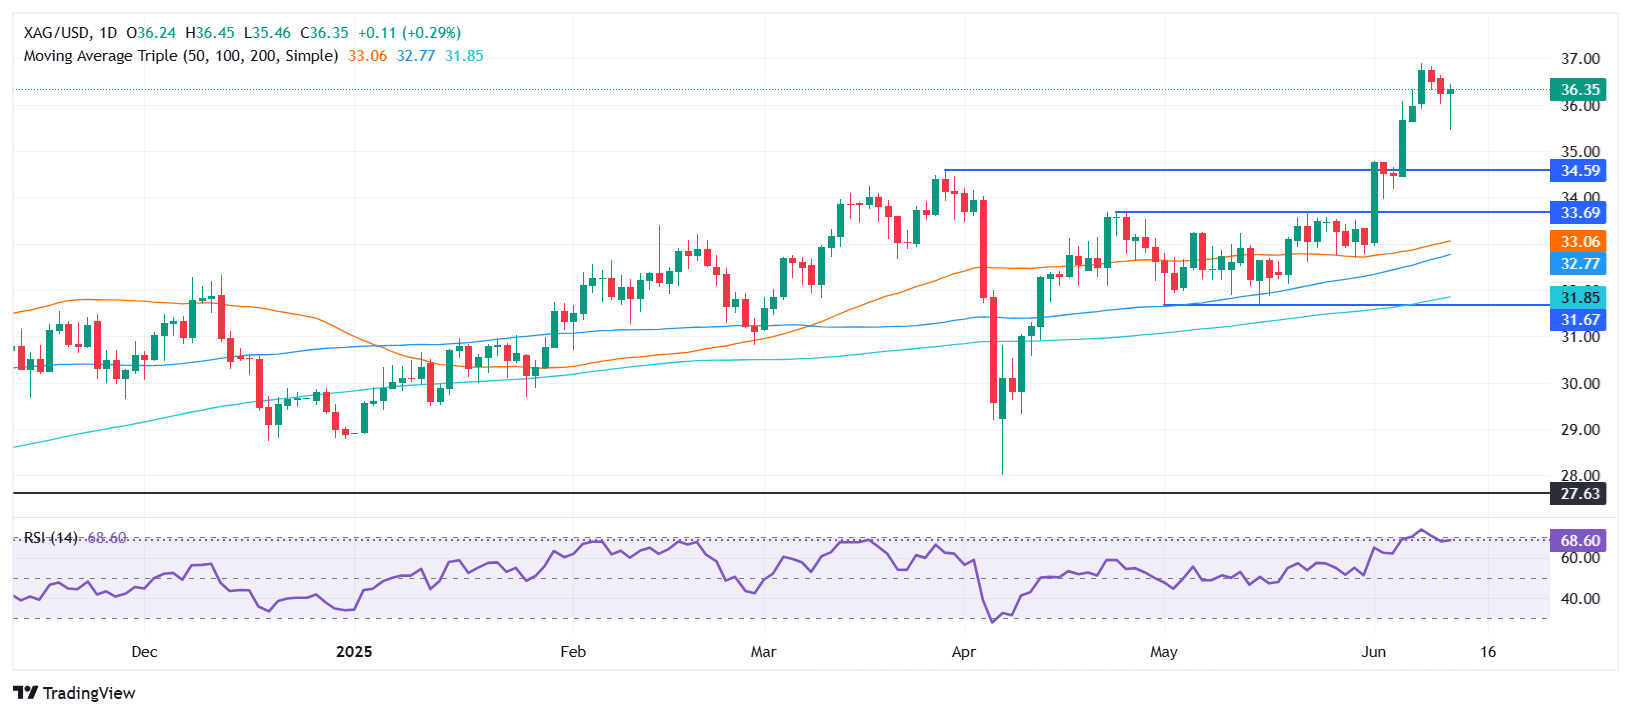
Silver price bounces off five-day lows of $35.46 and climbs past the $36.00 mark on Thursday as the Greenback gets battered, falling to nearly three-year lows. At the time of writing, the XAG/USD trades at $36.30, registering modest gains of 0.25% on Thursday, late in the North American session.
XAG/USD Price Forecast: Technical outlook
As Thursday’s session finishes, Silver’s uptrend would likely continue as a single candlestick chart pattern called a ‘hammer’ form. This means that XAG/USD could re-test the June 9 swing high at $36.88 before buyers set their sights on higher prices.
The Relative Strength Index (RSI) exited from overbought territory but, instead of aiming lower, remains flat. Therefore, the path of least resistance is tilted to the upsdide.
The first key resistance is the year-to-date (YTD) high, followed by the $37.00 figure. Once cleared, the next stop would be $37.49, a 13-year high set on February 29.
Conversely, if XAG/USD drops below $36.00, the first support level would be $35.40, a high from October 2012 that has since become a support level. Once surpassed, the next stop is $35.00, followed by the $34.00 and $33.00 figures,
XAG/USD Price Chart – Daily
Silver FAQs
Silver is a precious metal highly traded among investors. It has been historically used as a store of value and a medium of exchange. Although less popular than Gold, traders may turn to Silver to diversify their investment portfolio, for its intrinsic value or as a potential hedge during high-inflation periods. Investors can buy physical Silver, in coins or in bars, or trade it through vehicles such as Exchange Traded Funds, which track its price on international markets.
Silver prices can move due to a wide range of factors. Geopolitical instability or fears of a deep recession can make Silver price escalate due to its safe-haven status, although to a lesser extent than Gold's. As a yieldless asset, Silver tends to rise with lower interest rates. Its moves also depend on how the US Dollar (USD) behaves as the asset is priced in dollars (XAG/USD). A strong Dollar tends to keep the price of Silver at bay, whereas a weaker Dollar is likely to propel prices up. Other factors such as investment demand, mining supply – Silver is much more abundant than Gold – and recycling rates can also affect prices.
Silver is widely used in industry, particularly in sectors such as electronics or solar energy, as it has one of the highest electric conductivity of all metals – more than Copper and Gold. A surge in demand can increase prices, while a decline tends to lower them. Dynamics in the US, Chinese and Indian economies can also contribute to price swings: for the US and particularly China, their big industrial sectors use Silver in various processes; in India, consumers’ demand for the precious metal for jewellery also plays a key role in setting prices.
Silver prices tend to follow Gold's moves. When Gold prices rise, Silver typically follows suit, as their status as safe-haven assets is similar. The Gold/Silver ratio, which shows the number of ounces of Silver needed to equal the value of one ounce of Gold, may help to determine the relative valuation between both metals. Some investors may consider a high ratio as an indicator that Silver is undervalued, or Gold is overvalued. On the contrary, a low ratio might suggest that Gold is undervalued relative to Silver.
Recommended Articles


