USD/CHF Price Prediction: Now probably in a short and medium term bull trend

Tony
coverImg
Source: DepositPhotos

  • USD/CHF continues rising and might have established a medium-term uptrend. 


  • It is likely to continue higher although it is potentially overbought and a downside gap risks closing. 


USD/CHF is rising up and forming a sequence of higher highs and higher lows which indicates it is probably in both a short and – now also – a medium term uptrend. Given it is a key tenet of technical analysis that “the trend is your friend” the odds favor more upside to come. 


USD/CHF 4-hour Chart 
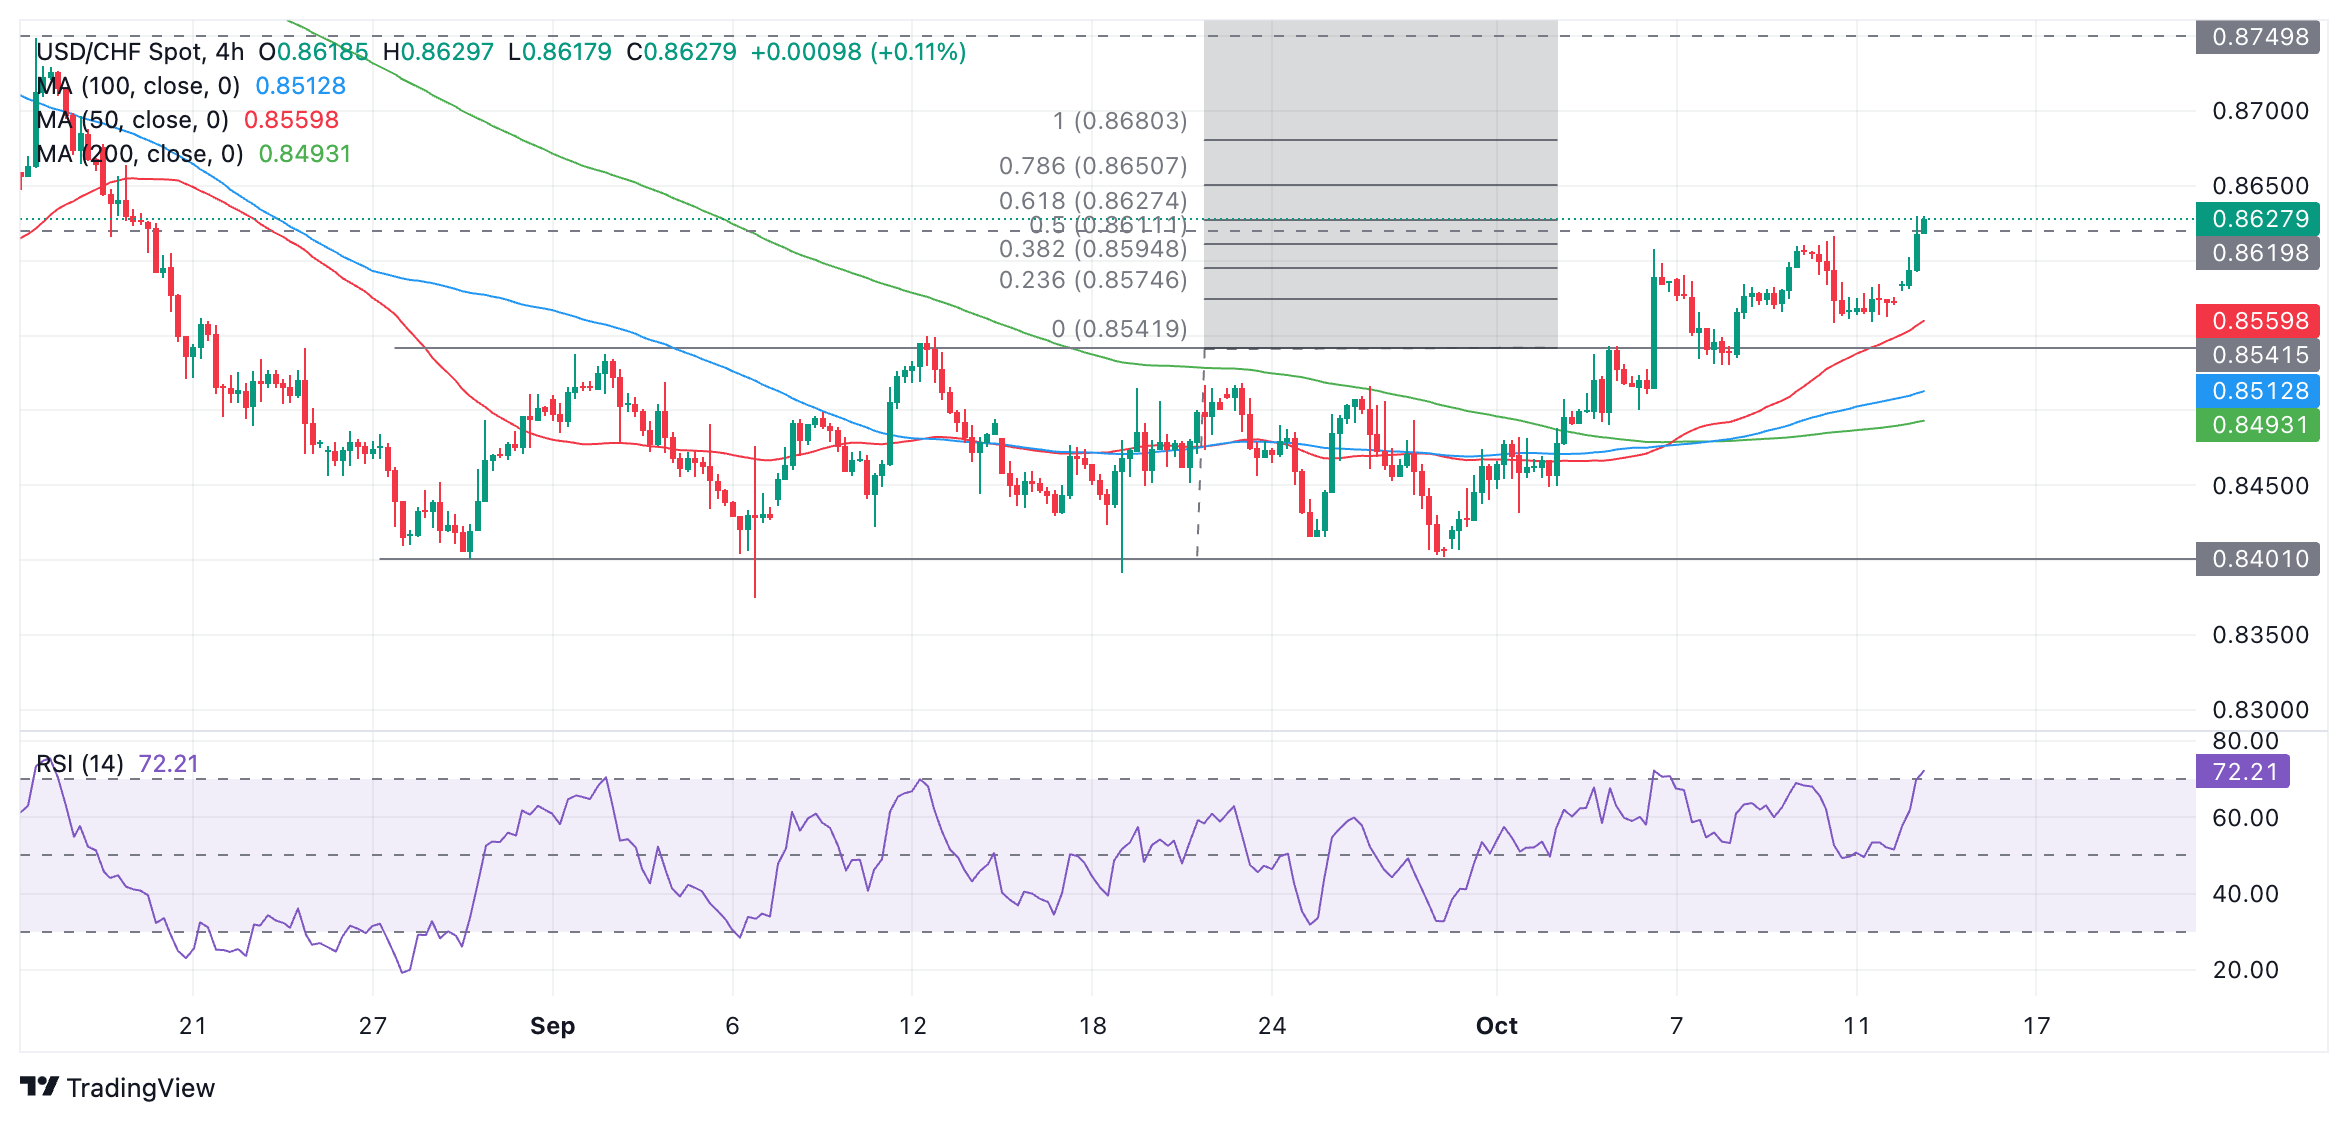

USD/CHF could continue rising until it reaches the next target to the upside which was generated when it broke out of the range. This target lies at 0.8680, the 100% Fibonacci (Fib) extrapolation of the height of the range higher. It has already met the conservative target at 0.8627, the 61.8% Fib level.


The Relative Strength Index (RSI) is in overbought territory and if it remains there on a closing basis it will advise traders not to add to their existing long positions. 

A chart gap opened on Monday morning and there is a risk the market could pull back to fill this gap at some point. 


Read more

  • Gold ends three-week slide at the $4,400 line — eight straight days of ETF inflows vs a 5% 10-year and a 100 dollar
  • Bitcoin squeezes back above $80,000 — 110,000 traders liquidated as the hawkish Fed and CLARITY setback fail to hold it down; is $83,000 next?
  • Bitcoin Falls Below $75,000, Crypto Stocks Plunge as Clarity Act Vote Fails
  • * The content presented above, whether from a third party or not, is considered as general advice only.  This article should not be construed as containing investment advice, investment recommendations, an offer of or solicitation for any transactions in financial instruments.

    goTop
    quote
    Related Articles
    placeholder
    Dollar index tops 100 for the first time since July as the Fed's hawkish dot plot sinks inThe U.S. dollar index broke back above 100 for the first time since 31 July after the Fed delivered its first rate hike since 2023, with the dot plot showing 16 of 18 officials expect at least one more increase this year. Here are the levels that matter for DXY, the currencies feeling it most, and what to watch next.
    Author  Irene Q.
    Sep 17, Thu
    The U.S. dollar index broke back above 100 for the first time since 31 July after the Fed delivered its first rate hike since 2023, with the dot plot showing 16 of 18 officials expect at least one more increase this year. Here are the levels that matter for DXY, the currencies feeling it most, and what to watch next.
    placeholder
    TradingKey Daily Market Briefing: Fed Raises Rates by 25 Bps, May Hike Again This Year; Gold Tumbles as Intel Rises 4%On September 16, Eastern Time, US stocks rose before pulling back following the Federal Reserve's rate decision announcement for September. The Fed unanimously decid
    Author  TradingKey
    Sep 17, Thu
    On September 16, Eastern Time, US stocks rose before pulling back following the Federal Reserve's rate decision announcement for September. The Fed unanimously decid
    placeholder
    September Fed Rate Decision Preview: Is a Rate Hike a Foregone Conclusion? US Stocks, Dollar, and Gold Face a Critical TestThe Federal Reserve will announce its September interest rate decision at 2:00 p.m. ET on Wednesday (September 16), followed by a press conference held by Fed Chair Kevin Warsh at 2:30 p.
    Author  TradingKey
    Sep 16, Wed
    The Federal Reserve will announce its September interest rate decision at 2:00 p.m. ET on Wednesday (September 16), followed by a press conference held by Fed Chair Kevin Warsh at 2:30 p.
    placeholder
    【Daily Brief】10-year Treasury yield briefly tops 5%, S&P 500 slips to 7,602 and the dollar firms at 99.3 as the Fed's decision eve beginsThe 10-year Treasury yield touched 5.014% on Monday — its first print above 5% since October 2023 — while the S&P 500 closed 0.48% lower at 7,619.98 and the dollar index firmed to 99.3. Here is the full market wrap ahead of Wednesday's FOMC decision, the dot plot and the August retail sales report, plus today's CLARITY Act Senate vote.
    Author  Irene Q.
    Sep 15, Tue
    The 10-year Treasury yield touched 5.014% on Monday — its first print above 5% since October 2023 — while the S&P 500 closed 0.48% lower at 7,619.98 and the dollar index firmed to 99.3. Here is the full market wrap ahead of Wednesday's FOMC decision, the dot plot and the August retail sales report, plus today's CLARITY Act Senate vote.
    placeholder
    US August CPI lands tonight: after a 5.4% PPI shock, will the Fed hike on September 16?US August PPI came in at 5.4% year-on-year, above the 5.3% consensus, with core PPI at 4.6%. Traders have pushed the odds of a 25bp Fed hike on September 15-16 to around 70%. Tonight's CPI is the last major inflation print before the decision — here is the full calendar, the consensus numbers, and what a hot versus cool reading would mean for the dollar, yields, gold and stocks.
    Author  Irene Q.
    Sep 11, Fri
    US August PPI came in at 5.4% year-on-year, above the 5.3% consensus, with core PPI at 4.6%. Traders have pushed the odds of a 25bp Fed hike on September 15-16 to around 70%. Tonight's CPI is the last major inflation print before the decision — here is the full calendar, the consensus numbers, and what a hot versus cool reading would mean for the dollar, yields, gold and stocks.

    USD Related Articles

    • Financial Markets 2026: Volatility Catalysts in Gold, Silver, Oil, and Blue-Chip Stocks—A CFD Trader's Outlook
    • Best Currency Pairs To Trade 2026: Guide to Choosing Currency Pairs
    • Trading Chart Patterns:Ultimate Guide to Price Action
    • Australian Dollar Forecast In 2024/2025/2026: Should I Buy AUD/USD Or Other AUD Currency Pairs?
    • AUD/USD holds above 0.6500, eyes on RBA Minutes

    Click to view more