

GBP/USD drifts higher to around 1.3520 in Monday’s early European session.
Positive view of the pair prevails above the 100-day EMA, with a bullish RSI indicator.
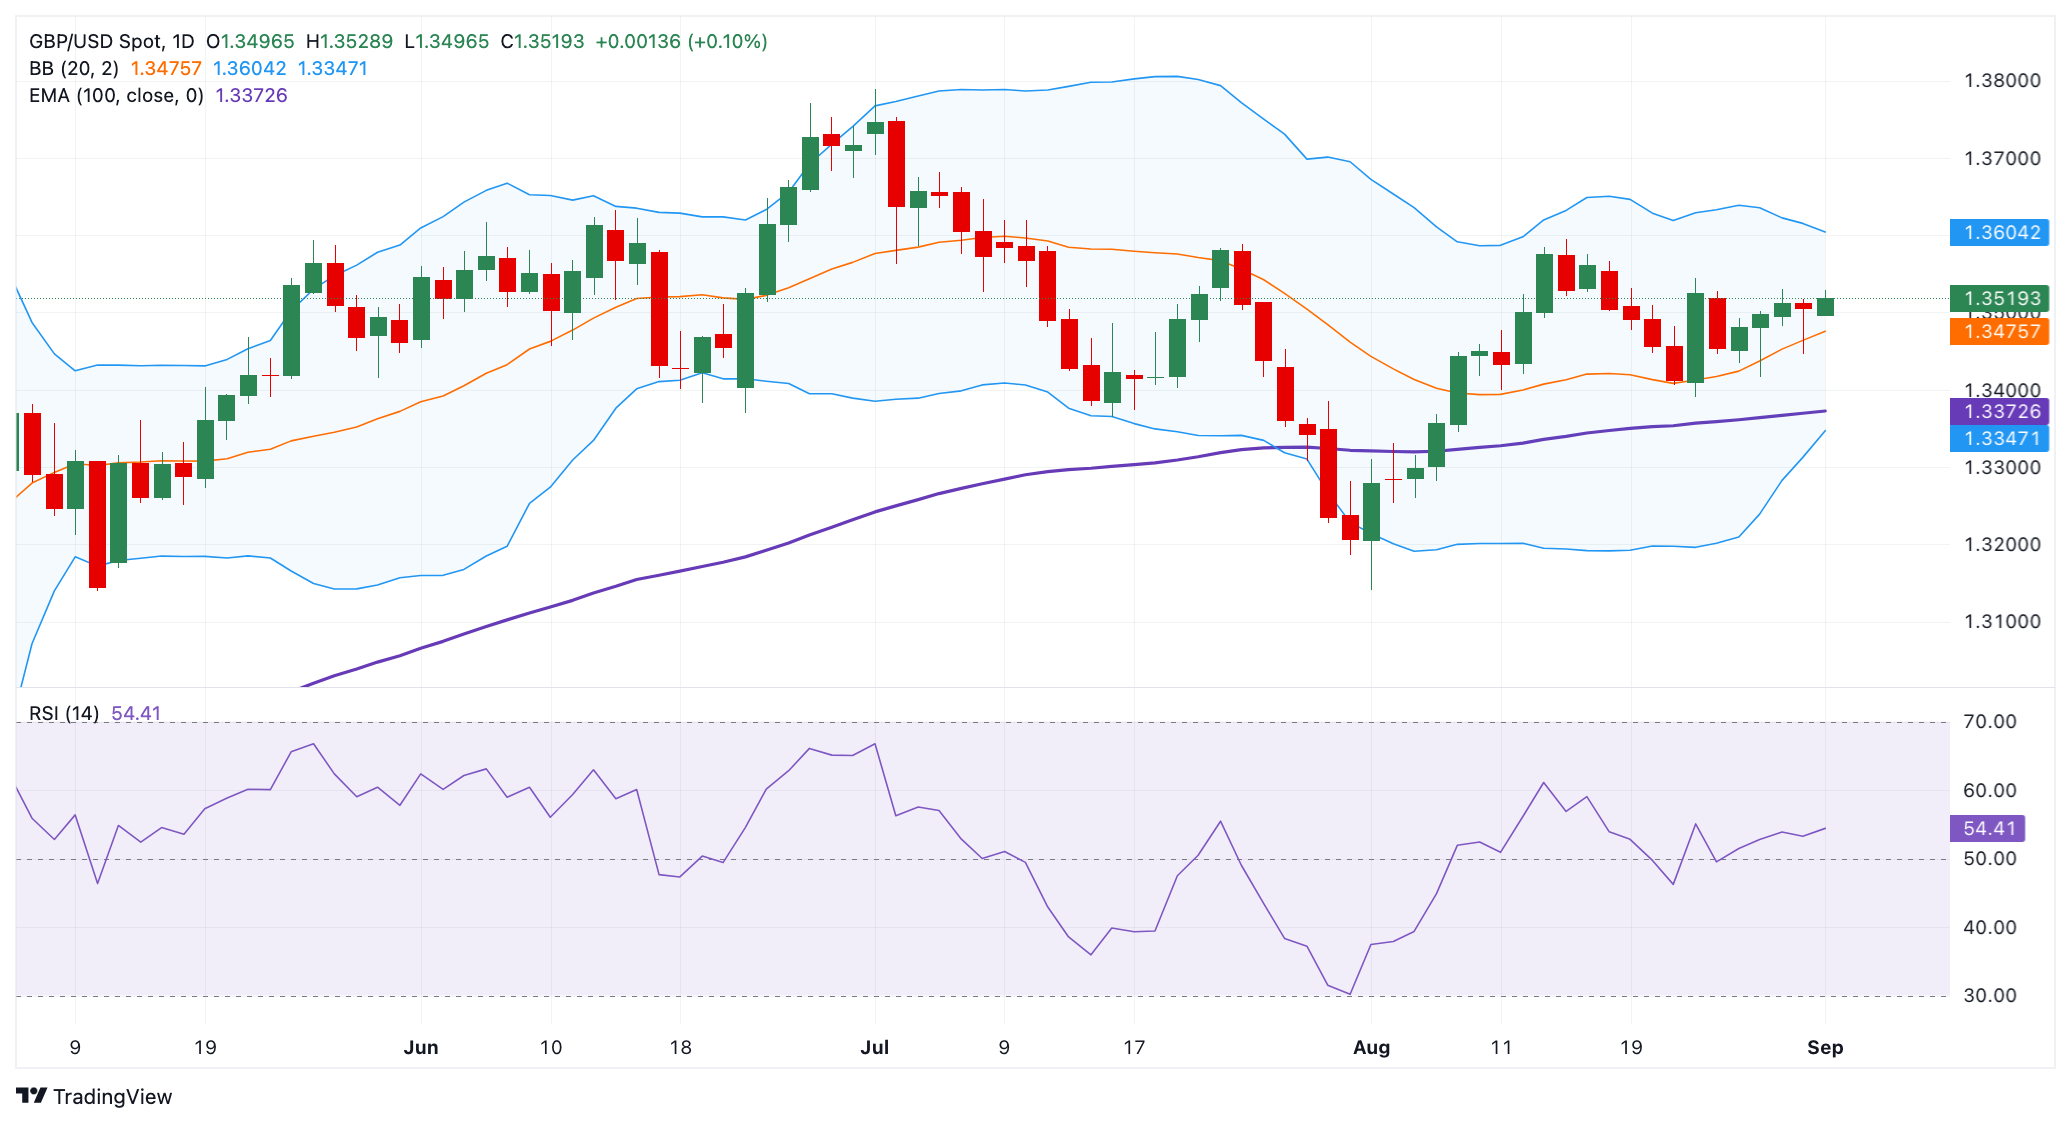
The immediate resistance level emerges in the 1.3600-1.3605 region; the first support level to watch is 1.3405.
The GBP/USD pair edges higher to near 1.3520 during the early European session on Monday. The growing prospect that the Federal Reserve (Fed) will lower borrowing costs at least twice by the end of this year undermines the US Dollar (USD) against the Pound Sterling (GBP).
Technically, the constructive outlook of GBP/USD remains in play, with the price being well-supported above the key 100-day Exponential Moving Average (EMA) on the daily chart. The upward momentum is reinforced by the 14-day Relative Strength Index (RSI) that stands above the midline. This displays the bullish momentum in the near term.
The first upside barrier emerges in the 1.3600-1.3605 zone, representing the psychological level and the upper boundary of the Bollinger Band. A decisive break above this level could pick up more momentum and aim for 1.3632, the high of June 13. Further north, the next resistance level is seen at 1.3770, the high of June 26.
On the downside, the low of August 21 at 1.3405 acts as an initial support level for GBP/USD. A breach of this level could drag the major pair toward 1.3372, the 100-day EMA. Extended losses could see a drop to 1.3345, the lower limit of the Bollinger Band.
GBP/USD daily chart
* The content presented above, whether from a third party or not, is considered as general advice only. This article should not be construed as containing investment advice, investment recommendations, an offer of or solicitation for any transactions in financial instruments.


