
Solana Price Forecast: SOL price stabilizes as new consensus proposal Alpenglow is likely to pass


Solana price stabilizes on Monday, following a nearly 3% drop in the previous week.
The Alpenglow (SIMD-0326) proposal is likely to pass, reducing block finality from 12.8 seconds to approximately 50 milliseconds.
Technical outlook turns positive, with funding rates supporting the case for a recovery ahead.
Solana (SOL) price is stabilizing around $200 at the time of writing on Monday, extending last week’s nearly 3% decline, but optimism is building around a key network upgrade. Reports indicate that the Alpenglow (SIMD-0326) consensus proposal is likely to pass on Tuesday, aiming to reduce block finality from 12.8 seconds to just 50 milliseconds. Meanwhile, the derivatives data showing positive funding rates suggest that SOL could be positioned for a recovery in the upcoming days.
Solana eyes recovery as new consensus upgrade boosts network
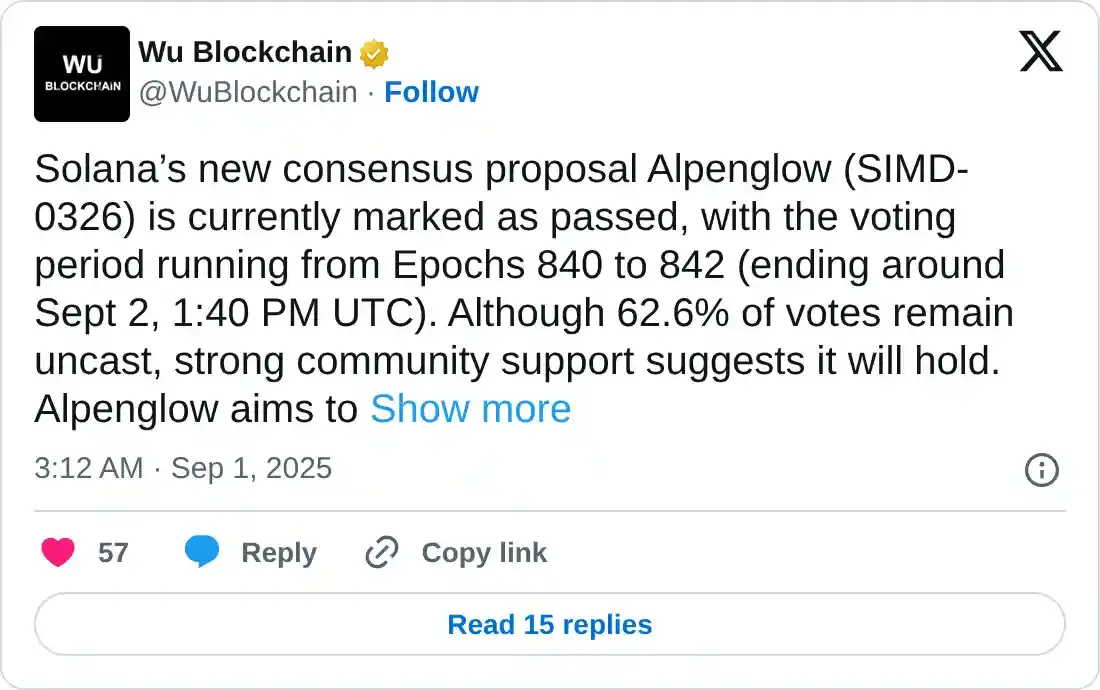
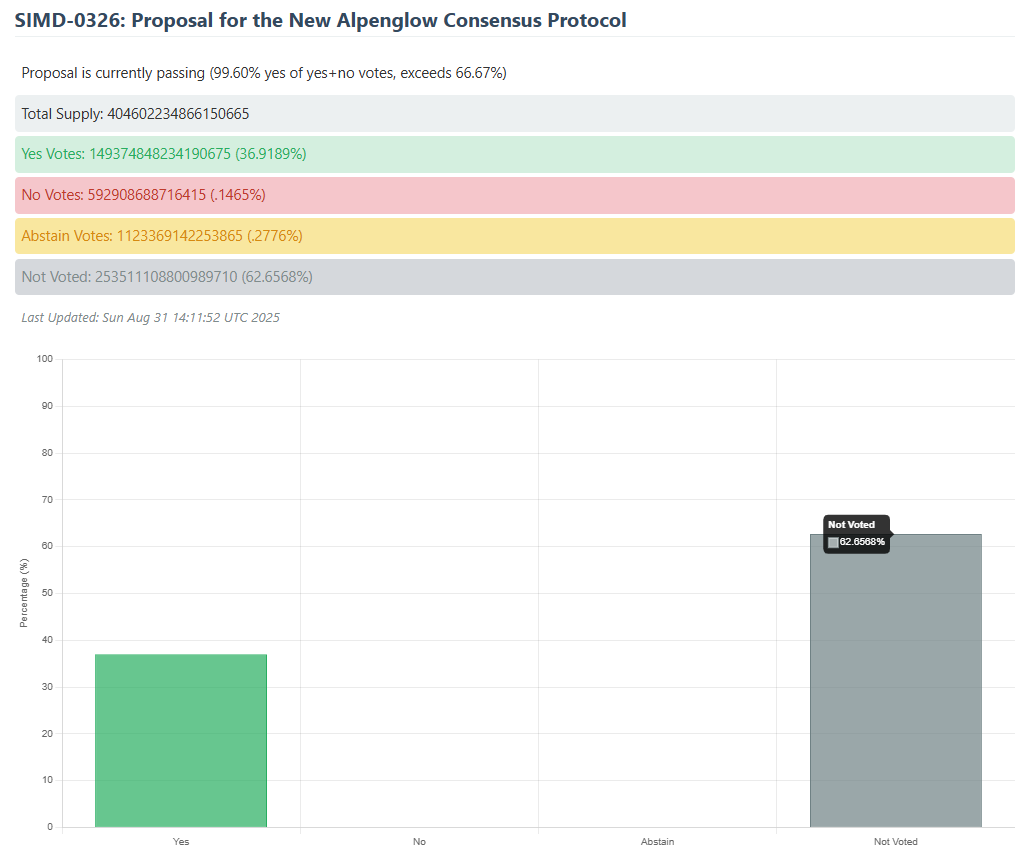
According to Wu Blockchain data on Monday, Solana’s new consensus proposal, Alpenglow (SIMD-0326), is currently marked as passed, with the voting period running from Epochs 840 to 842 and expected to conclude around Tuesday.
The graph below shows that currently 36.91% have voted yes, while 62.6% of votes remain uncast and strong community support suggests it will hold.
If passed on Tuesday, the Alpenglow consensus protocol could reduce block finality from 12.8 seconds to just 50 milliseconds, signaling a major leap in efficiency for the blockchain.
Apart from the optimism building around the network upgrade, Solana’s funding rate remains positive, at 0.0071% on Monday, indicating that longs are paying shorts and highlighting the ongoing bullish sentiment.
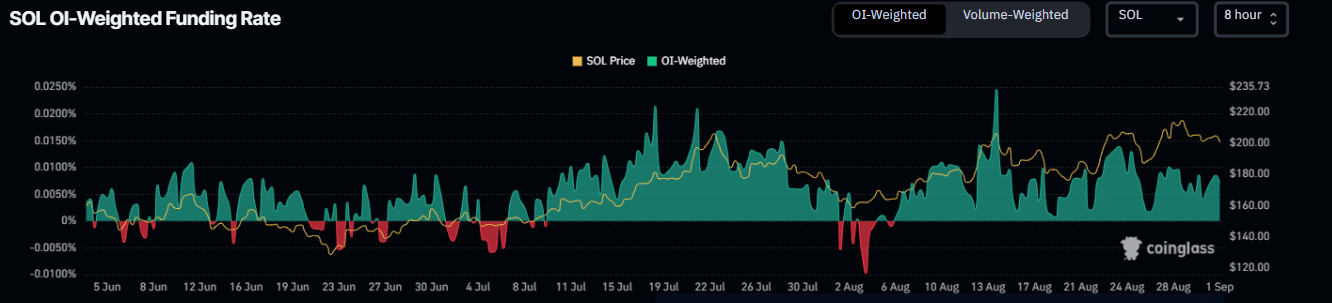
Solana funding rate chart. Source: Coinglass
Solana Price Forecast: SOL faces rejection from the key zone
Solana price got rejected from the upper trendline of a parallel channel (drawn by joining multiple highs and lows since mid-April) on Friday and declined 6.38% until Sunday. At the time of writing on Monday, it stabilizes at around $200.
If SOL recovers and breaks above the upper trendline boundary, it could extend the rally toward its next daily resistance at $230. A successful close above this level could extend the gains toward its record high of $295.83, set on January 19.
The Relative Strength Index (RSI) on the daily chart reads 54, which is above its neutral level of 50, indicating that bulls still have room for upward momentum. The Moving Average Convergence Divergence (MACD) has displayed a bullish crossover that remains in effect, further reinforcing the bullish outlook.
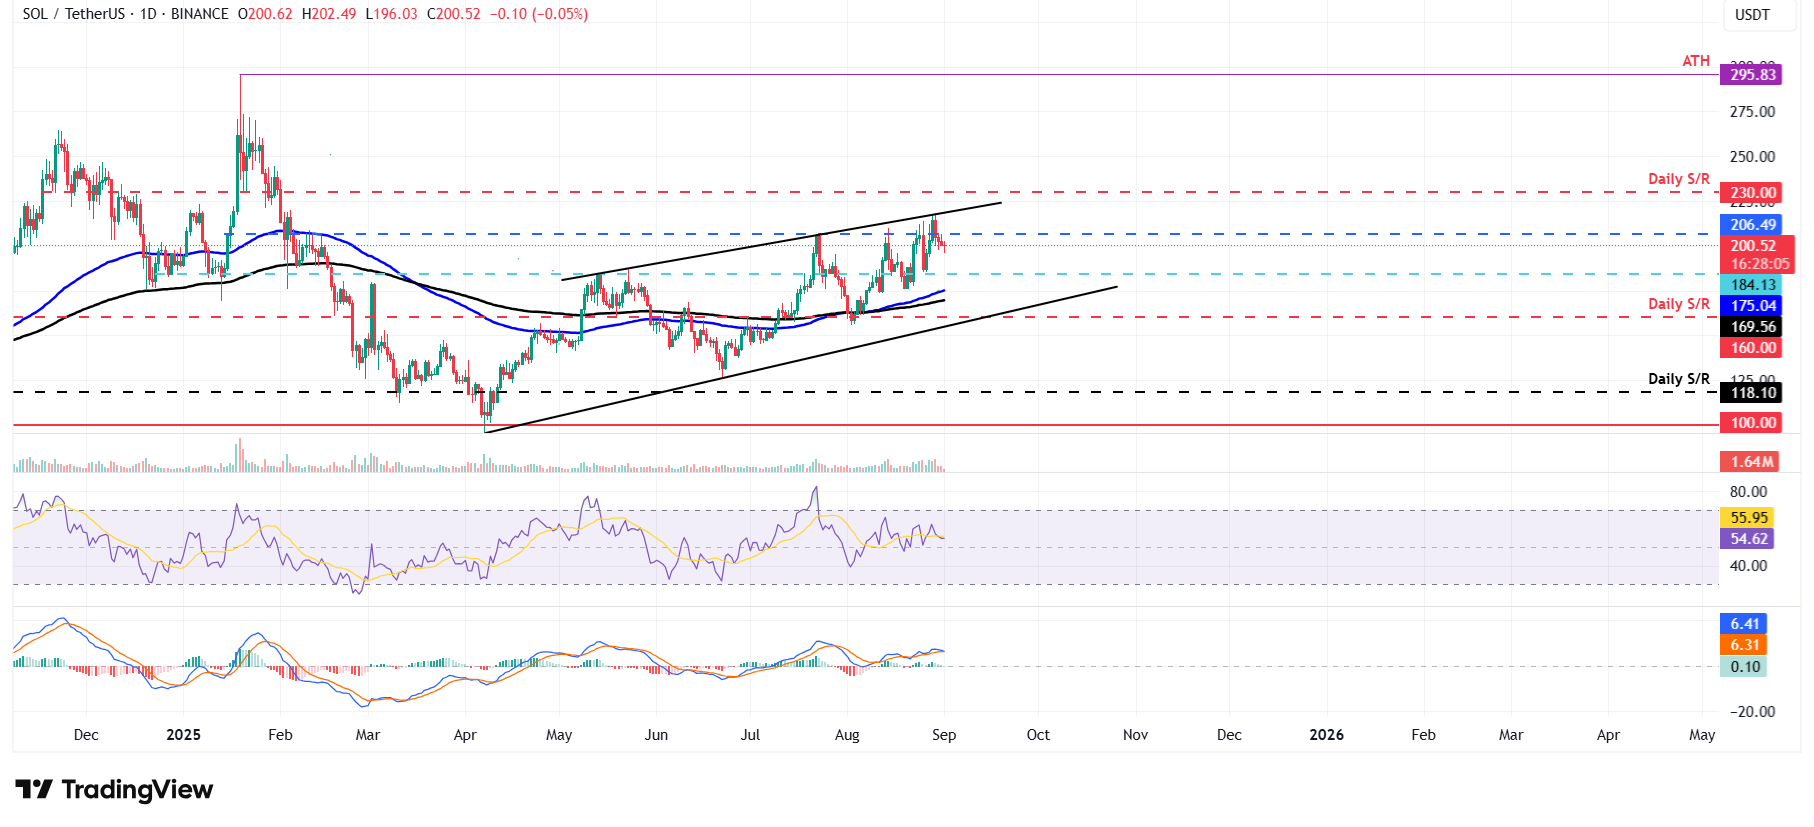
SOL/USDT daily chart
However, if SOL continues its correction, it could extend the decline to retest its next daily support at $184.13.
* The content presented above, whether from a third party or not, is considered as general advice only. This article should not be construed as containing investment advice, investment recommendations, an offer of or solicitation for any transactions in financial instruments.


