

GBP/USD Price Forecast: Hovers around 1.2950 near nine-day EMA

- WTI Oil pulls back as Hormuz supply worries ease, Iran-US tensions keep volatility high
- Trump says US to help ships stranded in Strait of Hormuz as tanker hit by projectiles
- WTI falls to near $93.50 after Israel, Iran signal an end to hostilities
- Bitcoin Price Forecast: BTC hits three-month high on derivatives-led surge
- Australian Dollar holds losses ahead of RBA policy decision
- Ignoring Strategy Reduction Warning, Bitcoin Nears $82,000, Hitting Highest Price Since February
GBP/USD challenges the immediate resistance near the four-month high of 1.3014.
The pair climbs above the nine-day EMA, strengthening the bullish outlook for short-term price action.
The nine-day EMA at 1.2936 acts as the nearest support level.
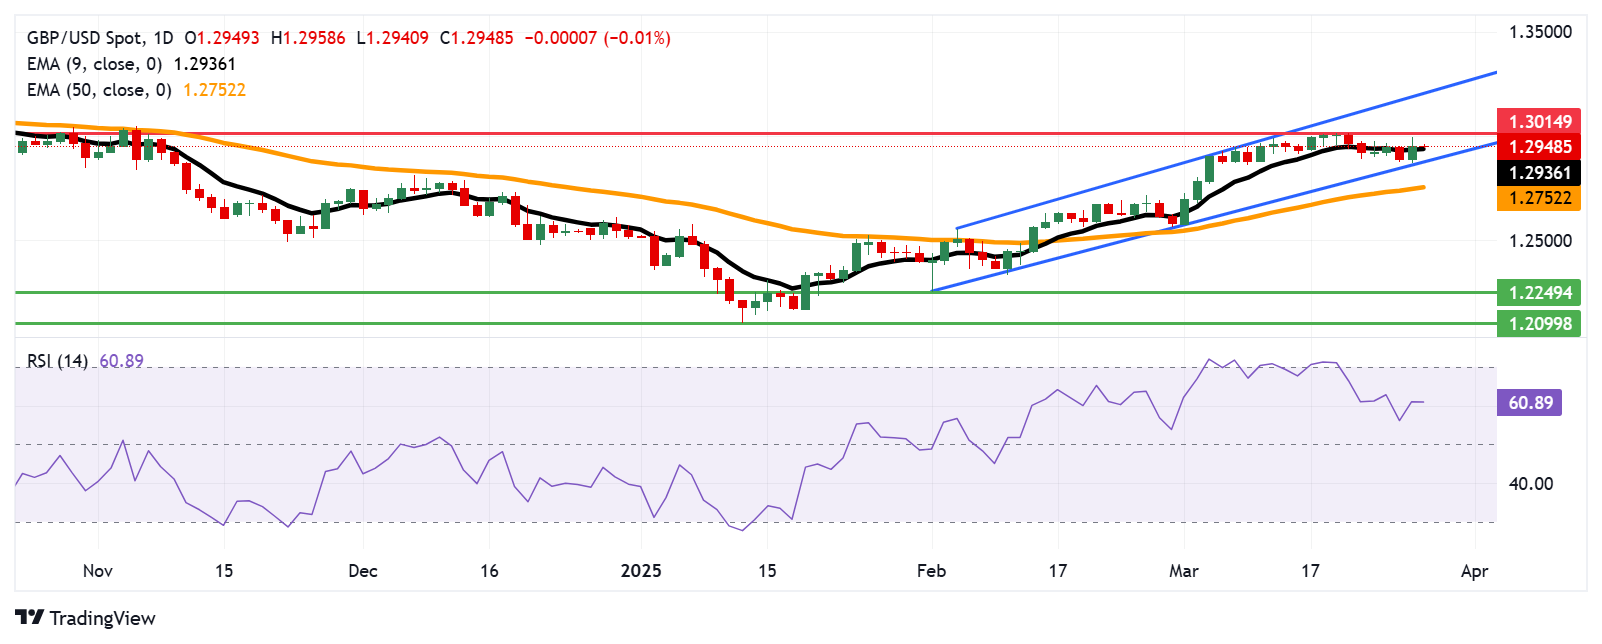
The GBP/USD pair holds steady after gains in the previous session, hovering around 1.2950 during Friday's Asian trading hours. The technical analysis of the daily chart suggests a sustained bullish outlook, with the pair consolidating within an ascending channel pattern.
The 14-day Relative Strength Index (RSI) stays above 50, signaling strong bullish momentum. Furthermore, the GBP/USD pair rebounds above the nine-day Exponential Moving Average (EMA), reinforcing a bullish outlook for short-term price movement.
The GBP/USD pair may encounter initial resistance near the four-month high of 1.3014, recorded on March 20. A continued advance could strengthen the bullish bias, potentially driving the pair toward the ascending channel’s upper boundary around 1.3210.
On the downside, the nine-day EMA at 1.2936 serves as the immediate support, followed by the ascending channel’s lower boundary near 1.2880. A break below this critical zone could weaken short-term price momentum, with the 50-day EMA at 1.2752 acting as the next key support. A further decline below this level may erode the medium-term bullish outlook, potentially pushing the pair toward the two-month low of 1.2249, recorded on February 3.
GBP/USD: Daily Chart
British Pound PRICE Today
The table below shows the percentage change of British Pound (GBP) against listed major currencies today. British Pound was the strongest against the New Zealand Dollar.

The heat map shows percentage changes of major currencies against each other. The base currency is picked from the left column, while the quote currency is picked from the top row. For example, if you pick the British Pound from the left column and move along the horizontal line to the US Dollar, the percentage change displayed in the box will represent GBP (base)/USD (quote).
Read more
* The content presented above, whether from a third party or not, is considered as general advice only. This article should not be construed as containing investment advice, investment recommendations, an offer of or solicitation for any transactions in financial instruments.


