

EUR/JPY Price Analysis: Bears back down and now is the buyer’s turn


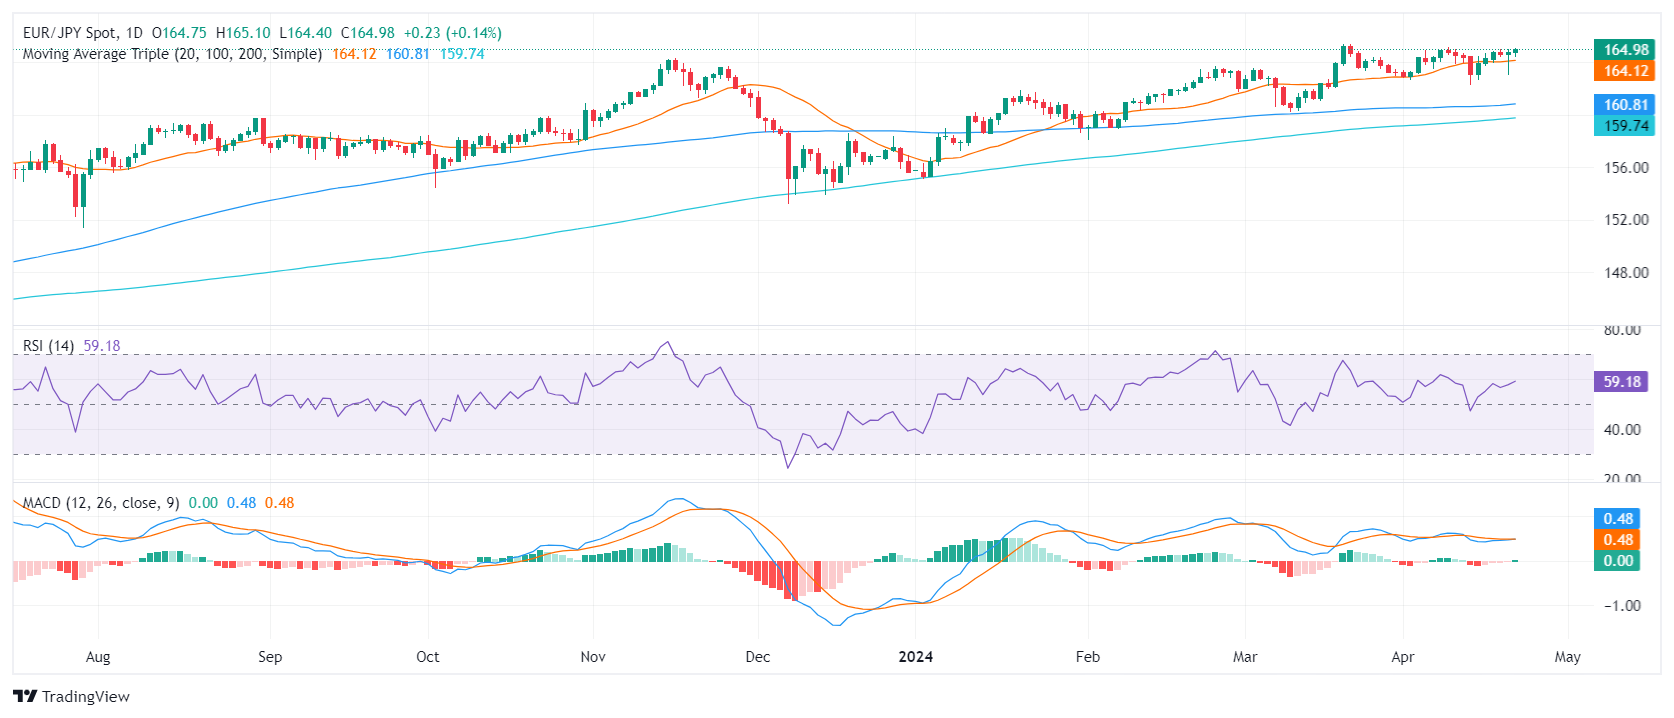
■The daily chart of EUR/JPY reveals a growing buying momentum, thanks to the RSI and the MACD strengthening.
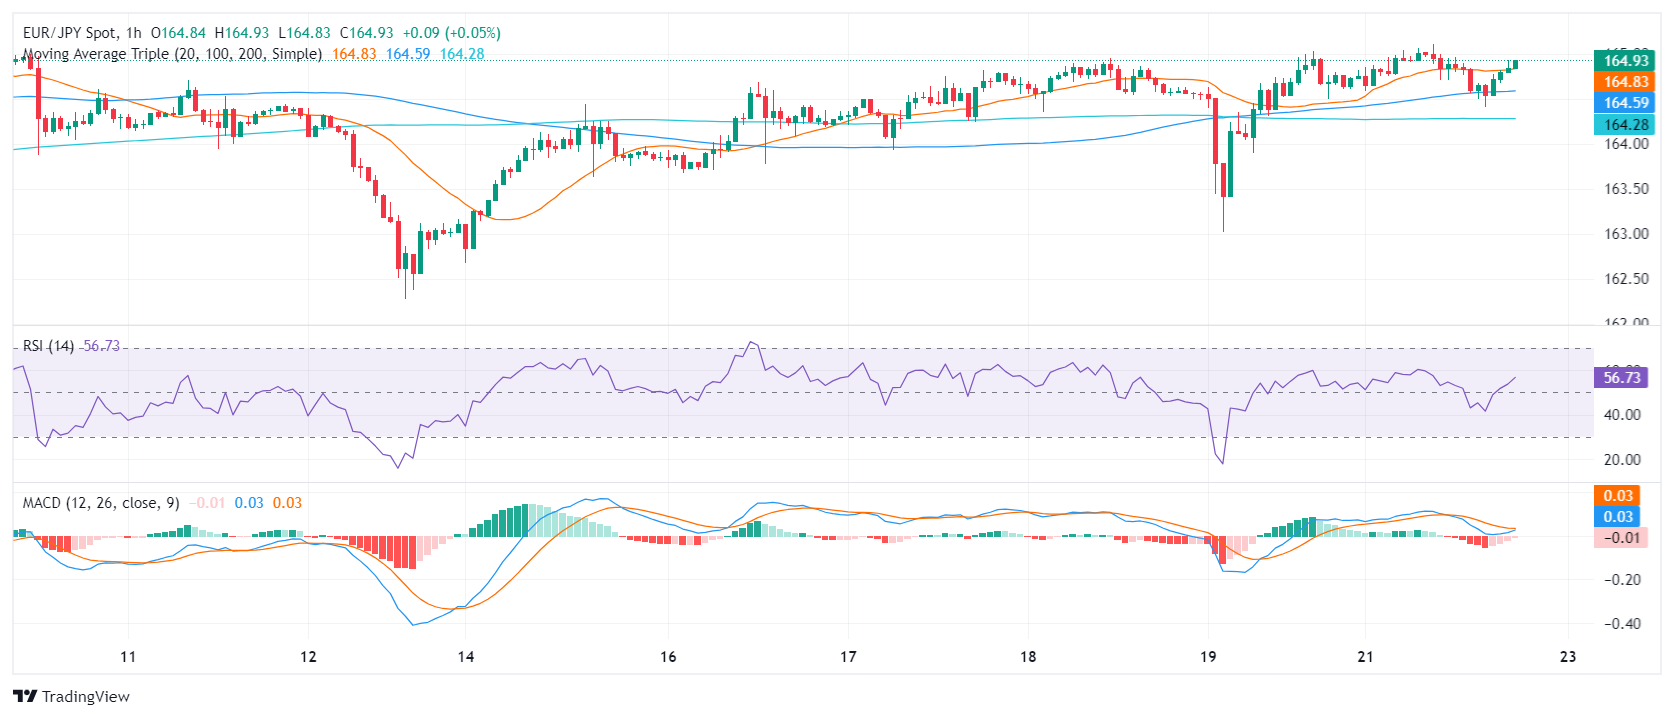
■The hourly chart shows a shift in market dynamics as indicators favor the buyers.
■Key Simple Moving Averages underline EUR/JPY's superiority, hinting at the potential long-term upside.
The EUR/JPY pair stands at 164.88, showing mild gains of on Monday’s session. The pair exhibits a firm bullish momentum echoed in the strengthening of the indicators on the hourly and daily charts.
Examining the Relative Strength Index (RSI) on the daily chart, indicates a continued rise towards the upper bounds, reinforcing upward momentum. The Moving Average Convergence Divergence (MACD) supports this positive momentum through fresh green bars, indicating strong buyer dominance.
EUR/JPY daily chart
In the hourly chart, the RSI has shown divergence from negative to positive territory, ranging from a low of 40 to a high of 56, which suggests a recovery of the buyers in the session. The hourly Moving Average Convergence Divergence (MACD) supports this as it prints decreasing red bars.
EUR/JPY hourly chart
In evaluating the broader market perspective, according to the Simple Moving Average (SMA), the pair's position above the 20, 100, and 200-day SMAs points towards a potential long-term positive trend. As long as the buyers keep the price above these key levels, the outlook will continue to be in their favor.
* The content presented above, whether from a third party or not, is considered as general advice only. This article should not be construed as containing investment advice, investment recommendations, an offer of or solicitation for any transactions in financial instruments.

