

XRP price started a fresh increase from the $2.050 zone. The price is back above $2.10 and might struggle to continue higher above the $2.20 zone.
XRP price started a fresh increase above the $2.120 zone.
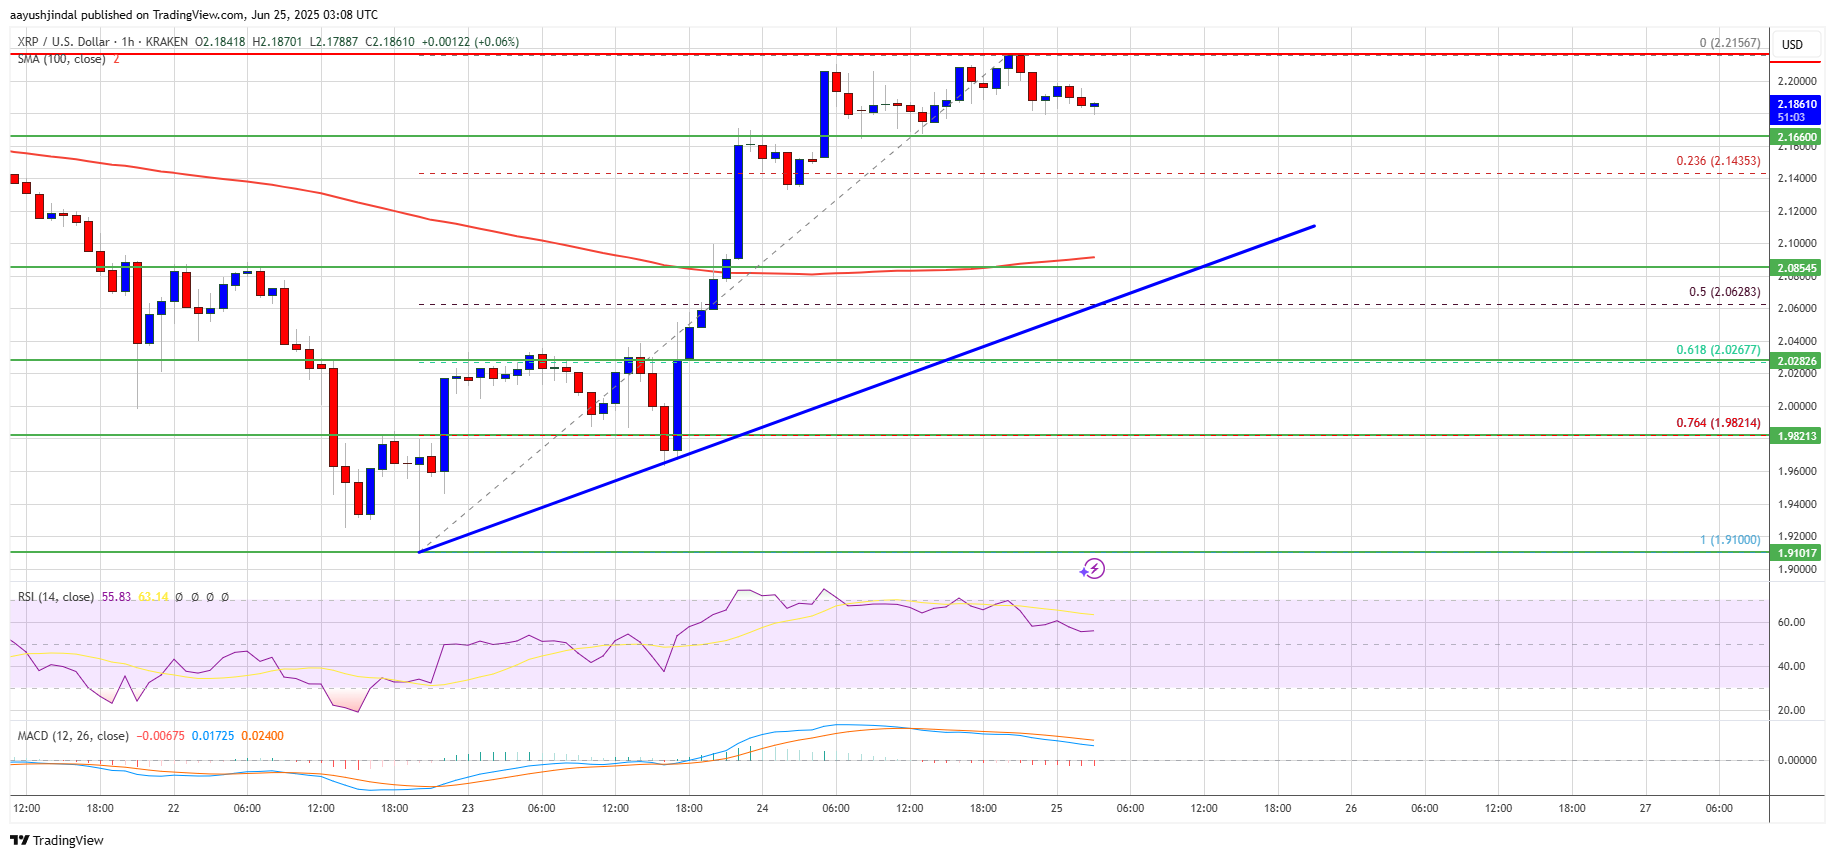
The price is now trading above $2.150 and the 100-hourly Simple Moving Average.
There is a bullish trend line forming with support at $2.080 on the hourly chart of the XRP/USD pair (data source from Kraken).
The pair could continue to move up if it closes above the $2.20 resistance zone.
XRP Price Faces Hurdles
XRP price remained supported above the $2.00 zone and started a fresh increase, like Bitcoin and Ethereum. The price recovered above the $2.020 and $2.080 resistance levels.
The pair even cleared the $2.150 resistance and spiked above the $2.20 barrier. However, the bears were active above the $2.20 zone. A high was formed at $2.215 and the price is now correcting some gains. There was a move below the $2.00 level, but the price is still above the 23.6% Fib retracement level of the upward move from the $1.910 swing low to the $2.2150 high.
The price is now trading above $2.150 and the 100-hourly Simple Moving Average. Besides, there is a bullish trend line forming with support at $2.080 on the hourly chart of the XRP/USD pair.
On the upside, the price might face resistance near the $2.20 level. The first major resistance is near the $2.220 level. The next resistance is $2.250. A clear move above the $2.250 resistance might send the price toward the $2.320 resistance.
Any more gains might send the price toward the $2.350 resistance or even $2.420 in the near term. The next major hurdle for the bulls might be $2.50.
Another Drop?
If XRP fails to clear the $2.20 resistance zone, it could start another decline. Initial support on the downside is near the $2.150 level. The next major support is near the $2.080 level.
If there is a downside break and a close below the $2.080 level, the price might continue to decline toward the $2.020 support or the 61.8% Fib retracement level of the upward move from the $1.910 swing low to the $2.2150 high. The next major support sits near the $1.950 zone.
Technical Indicators
Hourly MACD – The MACD for XRP/USD is now losing pace in the bullish zone.
Hourly RSI (Relative Strength Index) – The RSI for XRP/USD is now above the 50 level.
Major Support Levels – $2.150 and $2.080.
Major Resistance Levels – $2.20 and $2.250.
* The content presented above, whether from a third party or not, is considered as general advice only. This article should not be construed as containing investment advice, investment recommendations, an offer of or solicitation for any transactions in financial instruments.


