
Crypto Analyst Says Litecoin Is About To Pull An XRP, Here’s What He Means

Mitrade
coverImg
Source: DepositPhotos

Crypto analyst Tony Severino said Litecoin is about to pull an XRP, suggesting that the coin could soon enjoy a parabolic rally. The analyst alluded to a bullish indicator on LTC’s chart, which showed that the crypto could witness this parabolic rally. 


Litecoin Is About To Pull An XRP, Here’s Why


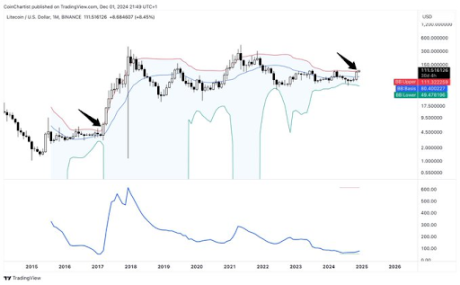
In an X post, Tony Severino said that Litecoin is about to pull an XRP, noting that the crypto is now above the monthly upper Bollinger Band. This suggests that LTC has undergone the necessary price correction and is now well-primed for a bullish reversal. The analyst’s accompanying chart showed that a wick to the upside was already forming for the crypto on the monthly chart. 

Litecoin XRP 1


Severino didn’t give a price target for how high Litecoin could rally when this move to the upside occurs. However, the chart showed that the $150 and $300 price levels were in view, a rally that could ultimately pave the way for LTC to rally to its current all-time high (ATH) of $412. It is worth mentioning that the crypto analyst had also recently made a similar analysis for XRP. 


Before now, Severino mentioned XRP is just above the monthly upper Bollinger Band just as BB Width expands from the tightest squeeze in XRP history. He added that this is going to shock and awe. Since then, XRP has enjoyed a parabolic rally of over 200% and is now above the $2 mark, a level the analyst’s chart showed the crypto could surpass. 


Therefore, this Litecoin analysis is undoubtedly one to watch since the crypto analyst predicts that LTC will pull an XRP. Litecoin has yet to enjoy its bull run, although it already looks to be catching up, considering it is up over 24% in the last seven days. 


The Next Dino Coin To Run?


Like Severino, crypto analyst Crypto Snorlax has also suggested that Litecoin will be the next ‘Dino coin’ to witness a parabolic rally. In an X post, the analyst highlighted a chart overlaying XRP’s price action over LTC’s. Based on this analysis, Crypto Snorlax revealed two interesting findings. 


Litecoin XRP 2


Firstly, he noted that there is a strong correlation between old altcoins. With XRP recording a 5x price increase from its bottom range, the analyst expects Litecoin to follow shortly. Secondly, Crypto Snorlax revealed that Litecoin just broke above $115, an 18-month resistance. 


Therefore, Litecoin is well primed for a significant rally, having flipped this resistance to support. The analyst’s accompanying chart showed that LTC could enjoy up to a 3x price increase and reach as high as $450, which would mark a new ATH for the crypto. 


At the time of writing, Litecoin is trading at around $121, up over 20% in the last 24 hours, according to data from CoinMarketCap. 


Litecoin price chart from Tradingview.com (XRP LTC)

Read more

  • US GDP grew 3.4% and core PCE held at 3.1% — December is now a hike trade, not a cut trade
  • * The content presented above, whether from a third party or not, is considered as general advice only.  This article should not be construed as containing investment advice, investment recommendations, an offer of or solicitation for any transactions in financial instruments.

    goTop
    quote
    Related Articles
    placeholder
    Nearly Half of $6 Billion Stolen in Binance Hack Frozen as BNB Rebounds Past $700, Targeting $800Binance Narrowly Intercepts $3 Billion; BNB Makes Strong V-Shaped Rebound Past $700, Targeting $800 in the Short Term.On October 30, impacted by a black swan event of a hacker attack, Bin
    Author  TradingKey
    Oct 30, Fri
    Binance Narrowly Intercepts $3 Billion; BNB Makes Strong V-Shaped Rebound Past $700, Targeting $800 in the Short Term.On October 30, impacted by a black swan event of a hacker attack, Bin
    placeholder
    US September PCE Inflation Rises to 3.6%, Gold Drops Below $4,000, Bitcoin Falls Below $77,000On October 30, gold (XAUUSD) and Bitcoin (BTC) continued to face pressure. U.S. September PCE inflation data showed year-over-year increases in both headline and core inflation. Coupled w
    Author  TradingKey
    Oct 30, Fri
    On October 30, gold (XAUUSD) and Bitcoin (BTC) continued to face pressure. U.S. September PCE inflation data showed year-over-year increases in both headline and core inflation. Coupled w
    placeholder
    Bitcoin is back above $80,000 — but 75% of the bounce was shorts, not buyersBitcoin trades at $80,669, back above the $80,000 line after touching $79,145 on October 24. But 75.4% of the last 24 hours of futures liquidations were shorts, CME open interest fell 36,545 BTC in October, and spot ETFs lost $773.5 million on October 22-23. Price is up; positioning is down. Here is why the bounce is a squeeze, and the four things that would make it real.
    Author  Suzie
    Oct 28, Wed
    Bitcoin trades at $80,669, back above the $80,000 line after touching $79,145 on October 24. But 75.4% of the last 24 hours of futures liquidations were shorts, CME open interest fell 36,545 BTC in October, and spot ETFs lost $773.5 million on October 22-23. Price is up; positioning is down. Here is why the bounce is a squeeze, and the four things that would make it real.
    placeholder
    Euro weakens below 1.1200 as traders brace for Fed, ECB rate decisionsThe EUR/USD pair extends the decline near 1.1170 during the early Asian trading hours on Tuesday, pressured by risk-off sentiment. Markets might turn cautious later in the day ahead of the US Federal Reserve (Fed) and European Central Bank (ECB) interest rate decisions later this week.
    Author  FXStreet
    Oct 27, Tue
    The EUR/USD pair extends the decline near 1.1170 during the early Asian trading hours on Tuesday, pressured by risk-off sentiment. Markets might turn cautious later in the day ahead of the US Federal Reserve (Fed) and European Central Bank (ECB) interest rate decisions later this week.
    placeholder
    Bitcoin Price Forecast: Drops Below $80,000 in Fifth Straight Loss, May Test $75,000 as FOMC Meeting Approaches Bitcoin falls below the $80,000 mark as the October FOMC decision approaches, threatening a further dip toward $75,000.On October 26, Bitcoin (BTC) again lost the key psychological mark o
    Author  TradingKey
    Oct 26, Mon
    Bitcoin falls below the $80,000 mark as the October FOMC decision approaches, threatening a further dip toward $75,000.On October 26, Bitcoin (BTC) again lost the key psychological mark o
    Live Quotes
    Name / SymbolChart% Change / Price
    LTCUSD
    LTCUSD
    0.00%0.00
    XRPUSD
    XRPUSD
    0.00%0.00

    cryptocurrency Related Articles

    • Top 3 Price Prediction: Bitcoin, Ethereum, Ripple — Bulls take the reins, with $100K BTC, $3,500 ETH and $2.35 XRP in focus
    • Best Strategies When BTC Price Drops: From Hedging to Accumulating
    • How to Day Trade Crypto? Simplest Day Trading Strategy Ever
    • Trading Chart Patterns:Ultimate Guide to Price Action
    • Places that Provide Cheapest Ways to Buy Bitcoin In 2025
    • 10 Best Crypto With Most Potential to Buy and invest in 2025 - Top Picks from Expert Traders

    Click to view more