
US Dollar Index Price Forecast: Tests 97.50 support near eight-week lows

- Gold Price Forecast: XAU/USD drifts higher above $4,200 as Fed delivers expected cut
- Gold Price Steady Climb and the Sudden Surge of Silver and Copper: Will Their Bull Run Extend Into 2026?
- Gold Price Forecast: XAU/USD climbs above $4,250 as Fed rate cut weakens US Dollar
- Bitcoin Cash Unveiled: Why Did BCH Price Surpass BTC? Can it Soar to $1,000 in the Future?
- Silver Price Forecast: XAG/USD refreshes record high, looks to build on move beyond $61.00
- AUD/USD holds steady below 0.6650, highest since September ahead of China's trade data

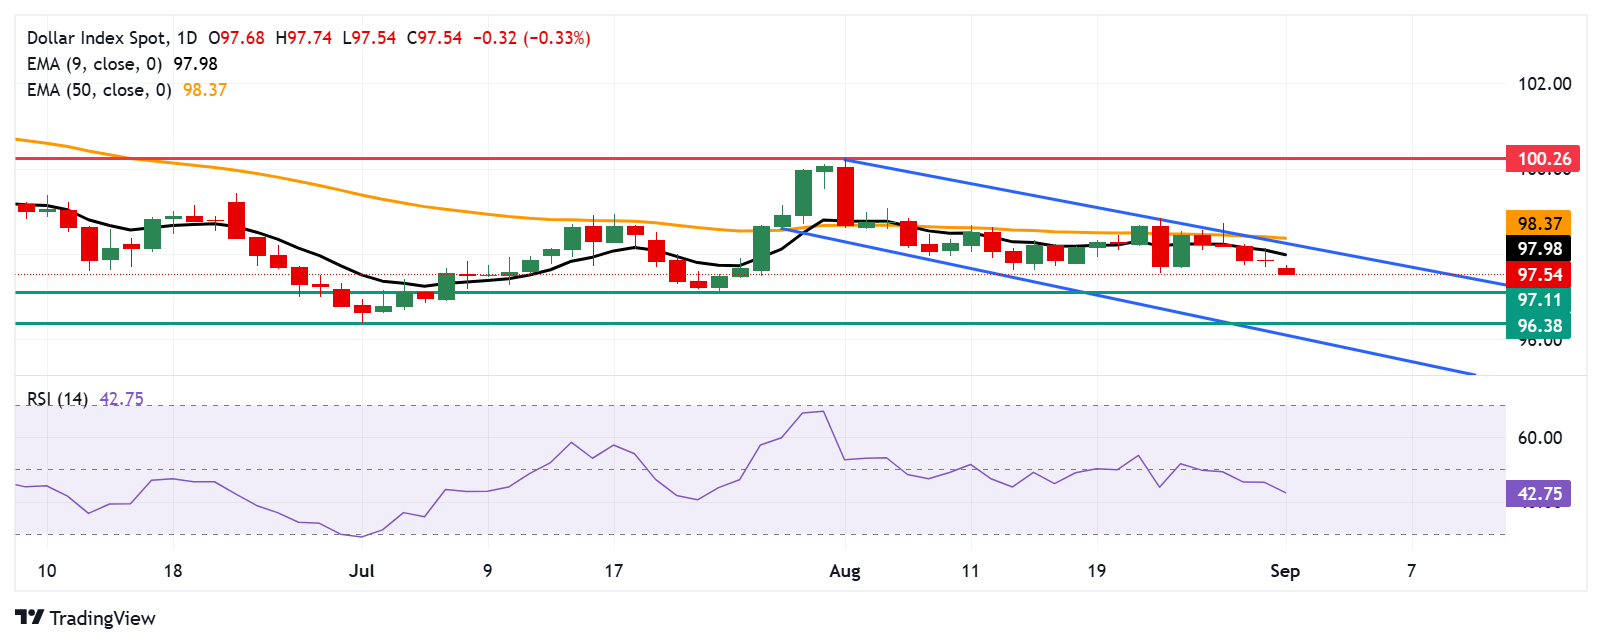
The US Dollar Index may find immediate support at an eight-week low of 97.11.
Market sentiment remains bearish with the 14-day Relative Strength Index holding below the 50 level.
The nine-day EMA at 97.98 could act as the primary barrier.
The US Dollar Index (DXY), which measures the value of the US Dollar (USD) against six major currencies, is extending its losses for the fifth consecutive session and trading around 97.60 during the European hours on Monday. The technical analysis of the daily chart shows the dollar index remains within the descending channel pattern, suggesting a prevailing bearish bias.
The 14-day Relative Strength Index (RSI) is positioned below the 50 level, strengthening the bearish bias. Additionally, the short-term price momentum is weaker as the DXY remains below the nine-day Exponential Moving Average (EMA).
On the downside, the US Dollar Index may target its initial support at an eight-week low of 97.11, which was recorded on July 24, followed by 96.38, the lowest since February 2022, which was recorded on July 1, 2025. Further declines would prompt the dollar index to test the descending channel’s lower boundary around 96.10.
The primary barrier lies at the nine-day EMA of 97.98, aligned with the psychological level of 98.00. A break above this crucial resistance zone would improve the short-term price momentum and support the US Dollar Index to test the upper boundary of the descending channel around 98.30, followed by the 50-day EMA at 98.37. Further advances would improve the medium-term price momentum and lead the DXY to explore the region around the four-month high at 100.26, which was recorded on August 1.
US Dollar Index: Daily Chart
US Dollar Price Today
The table below shows the percentage change of US Dollar (USD) against listed major currencies today. US Dollar was the weakest against the New Zealand Dollar.

The heat map shows percentage changes of major currencies against each other. The base currency is picked from the left column, while the quote currency is picked from the top row. For example, if you pick the US Dollar from the left column and move along the horizontal line to the Japanese Yen, the percentage change displayed in the box will represent USD (base)/JPY (quote).
Read more
* The content presented above, whether from a third party or not, is considered as general advice only. This article should not be construed as containing investment advice, investment recommendations, an offer of or solicitation for any transactions in financial instruments.


