

Chainlink holds near three-year high fueled by EU tokenized securities partnership

Tony
coverImg
Source: DepositPhotos

  • Chainlink price trades slightly down on Tuesday after rallying more than 33% the previous day.


  • Chainlink announced on Monday a partnership with 21x for Europe’s first tokenized securities trading and settlement system.


  • On-chain data suggest further gains ahead as LINK’s daily trading volume and the number of active addresses reach record levels.


Chainlink (LINK) price trades slightly down around $25.50 on Tuesday following a 33% rally that was spurred by its partnership with Frankfurt-based fintech 21X for Europe’s first tokenized securities trading and settlement system. The technical outlook and on-chain metrics suggest further gains ahead, as LINK’s daily trading volume and the number of active addresses reach record levels.


Chainlink announces partnership with 21X


Chainlink announced on Monday that Frankfurt-based fintech company 21X would adopt the Chainlink standard, adding to the project’s growing list of partnerships and integrations. This announcement led Chainlink prices to rally more than 33% on Monday.


“We’re excited to announce Europe’s first tokenized securities trading & settlement system—21X,” said Chainlink in its Twitter post on Monday.

LINK’s on-chain metrics show bullish outlook


Delving deeper into the on-chain metrics supports LINK’s bullish outlook. Santiment’s Daily Active Addresses index, which tracks network activity over time, rose from 4,999 on Sunday to 138,851 on Tuesday, the highest level since mid-January 2023. This indicates that demand for LINK’s blockchain usage is increasing, which bodes well for Chainlink’s price outlook.


Chainlink’s daily active addresses chart. Source: Santiment

Chainlink’s daily active addresses chart. Source: Santiment


Another aspect bolstering the platform’s bullish outlook is a recent surge in traders’ interest and liquidity in the LINK’s chain. Token Terminal’s data shows that LINK’s daily trading volume reached $12.15 billion on Monday, the highest daily volume so far this year.
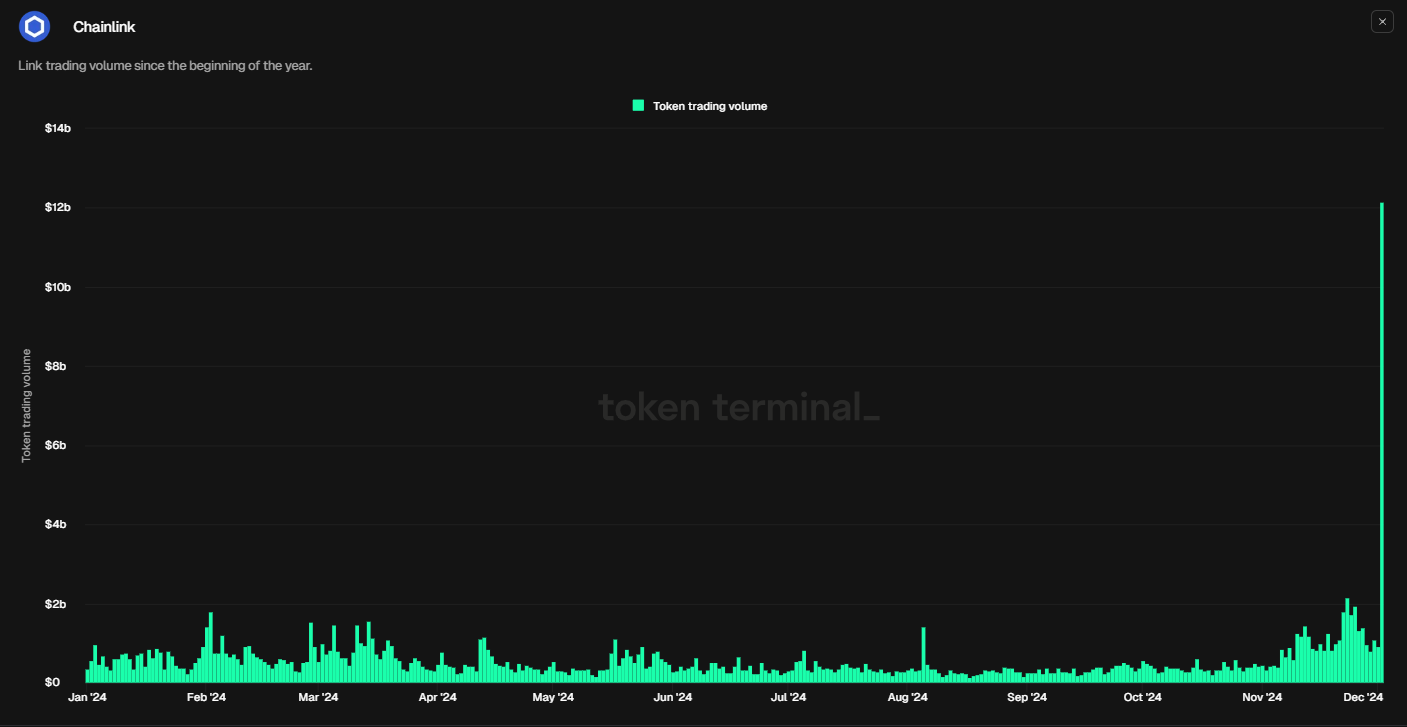

LINK daily trading volume chart. Source: Token Terminal

LINK daily trading volume chart. Source: Token Terminal


Chainlink Price Forecast: Bulls eye $38


Chainlink price surged 5.6% last week, closing above the ascending trendline drawn by connecting multiple weekly high levels from early November 2021. At the start of this week, the upward trend extended, rallying 36.5% until Tuesday, breaking above the weekly resistance of $22.56.


If LINK price continues to increase, it could extend the rally by 54% to retest its November 2021 high of $38.31.


The weekly chart’s Relative Strength Index (RSI) stands at 73, trading slightly above its overbought level of 70. Traders should be cautious because the chances of a price pullback are increasing. Still, the RSI is still pointing upwards, so there is the possibility that the rally continues and the indicator remains above the overbought level.
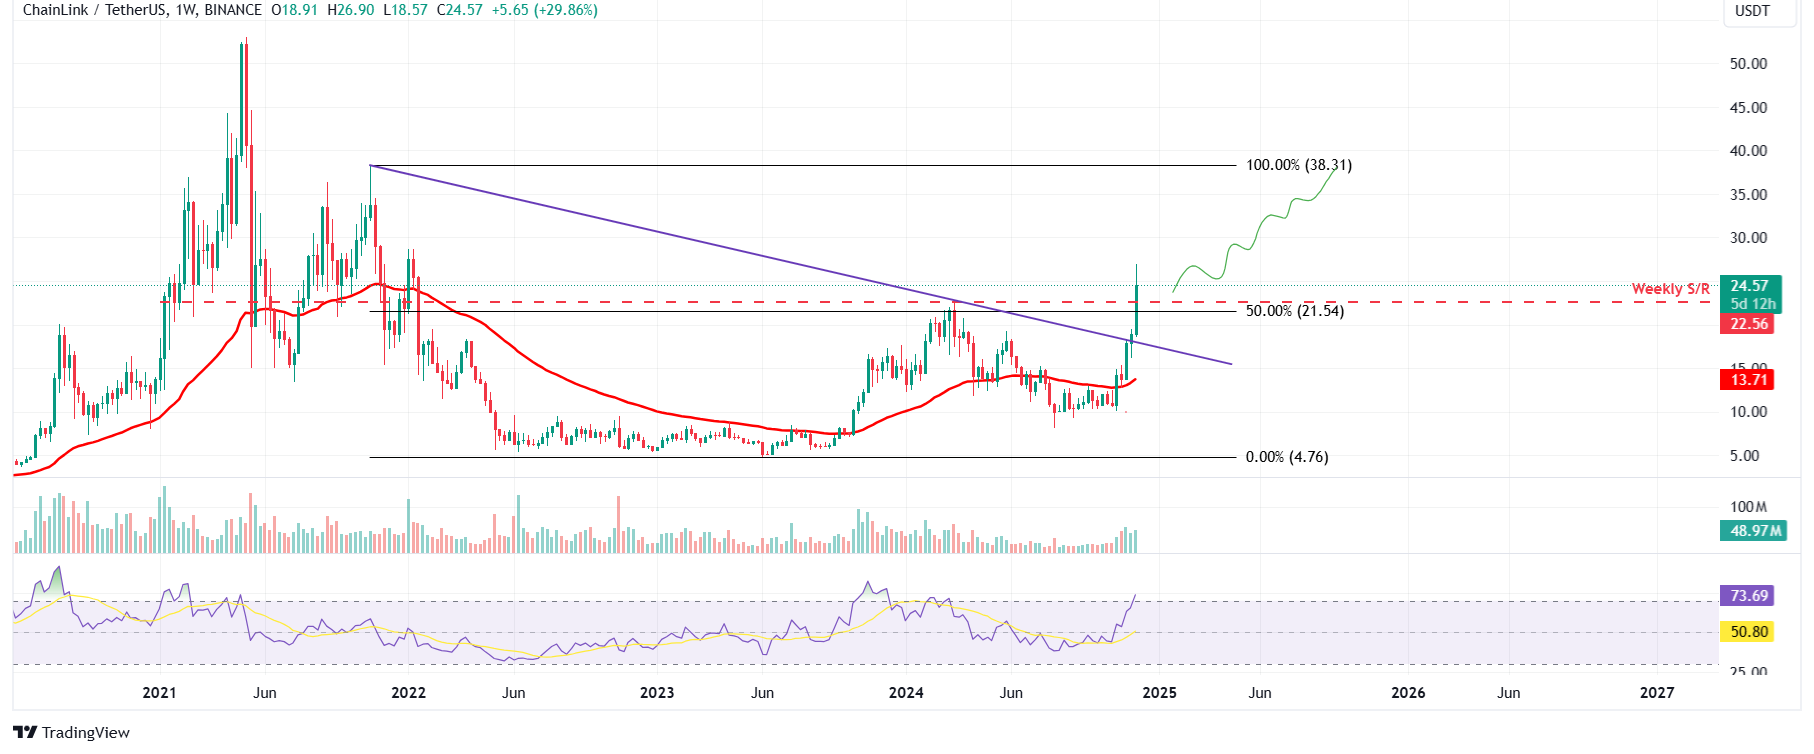

LINK/USDT weekly chart

LINK/USDT weekly chart


Read more

  • US Sept. PCE Preview: Inflation May Heat Up Again, How Will US Stocks, the Dollar, and Gold React?
  • Gold rises above $4,050 ahead of Fed rate decision
  • * The content presented above, whether from a third party or not, is considered as general advice only.  This article should not be construed as containing investment advice, investment recommendations, an offer of or solicitation for any transactions in financial instruments.

    goTop
    quote
    Related Articles
    placeholder
    Bitcoin is back above $80,000 — but 75% of the bounce was shorts, not buyersBitcoin trades at $80,669, back above the $80,000 line after touching $79,145 on October 24. But 75.4% of the last 24 hours of futures liquidations were shorts, CME open interest fell 36,545 BTC in October, and spot ETFs lost $773.5 million on October 22-23. Price is up; positioning is down. Here is why the bounce is a squeeze, and the four things that would make it real.
    Author  Suzie
    20 hours ago
    Bitcoin trades at $80,669, back above the $80,000 line after touching $79,145 on October 24. But 75.4% of the last 24 hours of futures liquidations were shorts, CME open interest fell 36,545 BTC in October, and spot ETFs lost $773.5 million on October 22-23. Price is up; positioning is down. Here is why the bounce is a squeeze, and the four things that would make it real.
    placeholder
    Euro weakens below 1.1200 as traders brace for Fed, ECB rate decisionsThe EUR/USD pair extends the decline near 1.1170 during the early Asian trading hours on Tuesday, pressured by risk-off sentiment. Markets might turn cautious later in the day ahead of the US Federal Reserve (Fed) and European Central Bank (ECB) interest rate decisions later this week.
    Author  FXStreet
    Oct 27, Tue
    The EUR/USD pair extends the decline near 1.1170 during the early Asian trading hours on Tuesday, pressured by risk-off sentiment. Markets might turn cautious later in the day ahead of the US Federal Reserve (Fed) and European Central Bank (ECB) interest rate decisions later this week.
    placeholder
    Bitcoin Price Forecast: Drops Below $80,000 in Fifth Straight Loss, May Test $75,000 as FOMC Meeting Approaches Bitcoin falls below the $80,000 mark as the October FOMC decision approaches, threatening a further dip toward $75,000.On October 26, Bitcoin (BTC) again lost the key psychological mark o
    Author  TradingKey
    Oct 26, Mon
    Bitcoin falls below the $80,000 mark as the October FOMC decision approaches, threatening a further dip toward $75,000.On October 26, Bitcoin (BTC) again lost the key psychological mark o
    placeholder
    Bitcoin's double top at $88,000: why $78,000 is the line that decides the next moveBitcoin trades near $82,500 (+0.47%) after twice failing at the $88,000 area, forming a potential double top with a neckline at $78,000. A break below the neckline would project a measured target near $68,200; a close back above $88,000 would invalidate the pattern. Here are the structure, the levels and what would confirm either side.
    Author  Suzie
    Oct 19, Mon
    Bitcoin trades near $82,500 (+0.47%) after twice failing at the $88,000 area, forming a potential double top with a neckline at $78,000. A break below the neckline would project a measured target near $68,200; a close back above $88,000 would invalidate the pattern. Here are the structure, the levels and what would confirm either side.
    placeholder
    Bitcoin's V-shaped rebound: from $80,953 back above $83,000 — spot buyers step in as the Fed softens, but ETF outflows lingerBitcoin slid to $80,953 on October 13 — then snapped back above $83,000, reclaiming the 81,847–82,305 'golden zone' on spot-led buying as Williams and Waller cooled the Fed's hawkish tone and the dollar pulled back from its 18-month high. But October ETF outflows near $386 million and a fear-and-greed reading of 56 say the repair is unfinished. Here are the levels, the transmission chain and both cases ahead of tonight's US CPI.
    Author  Suzie
    Oct 14, Wed
    Bitcoin slid to $80,953 on October 13 — then snapped back above $83,000, reclaiming the 81,847–82,305 'golden zone' on spot-led buying as Williams and Waller cooled the Fed's hawkish tone and the dollar pulled back from its 18-month high. But October ETF outflows near $386 million and a fear-and-greed reading of 56 say the repair is unfinished. Here are the levels, the transmission chain and both cases ahead of tonight's US CPI.
    Live Quotes
    Name / SymbolChart% Change / Price
    LINKUSD
    LINKUSD
    0.00%0.00

    cryptocurrency Related Articles

    • Top 3 Price Prediction: Bitcoin, Ethereum, Ripple — Bulls take the reins, with $100K BTC, $3,500 ETH and $2.35 XRP in focus
    • Best Strategies When BTC Price Drops: From Hedging to Accumulating
    • How to Day Trade Crypto? Simplest Day Trading Strategy Ever
    • Trading Chart Patterns:Ultimate Guide to Price Action
    • Places that Provide Cheapest Ways to Buy Bitcoin In 2025
    • 10 Best Crypto With Most Potential to Buy and invest in 2025 - Top Picks from Expert Traders

    Click to view more