
Meme Coins Price Predictions: DOGE, SHIB, PEPE hit crucial crossroads, eye further gains


Dogecoin edges lower after a 12% recovery last week, struggling to overcome $0.17 resistance.
Shiba Inu ticks lower by 2% following a trendline breakout, targets $0.00001200 breakout.
Pepe softens by 2% as it struggles to surpass an overhead trendline.
Meme coins, such as Dogecoin (DOGE), Shiba Inu (SHIB), and Pepe (PEPE), performed remarkably well last week, with a swift recovery reaching a high point on Sunday. The meme coins soften slightly on Monday as bulls struggle to overcome critical resistance, while a breakout could trigger extended gains.
Dogecoin’s reversal run hits a roadblock
Dogecoin dropped 1% at press time on Monday, losing steam after a bullish recovery week of 12%. Starting the week on a soft note, DOGE struggles to overcome the $0.17 resistance last tested on June 19.
A daily close above this level could extend the meme coin’s recovery towards the monthly high at $0.20 psychological level.
The Moving Average Convergence/Divergence (MACD) indicator displays a bullish crossover (MACD line crossing above its signal line), triggering a trend reversal signal.
The Relative Strength Index (RSI) at 44 gradually reverses from the oversold zone, indicating a decline in overhead supply pressure.
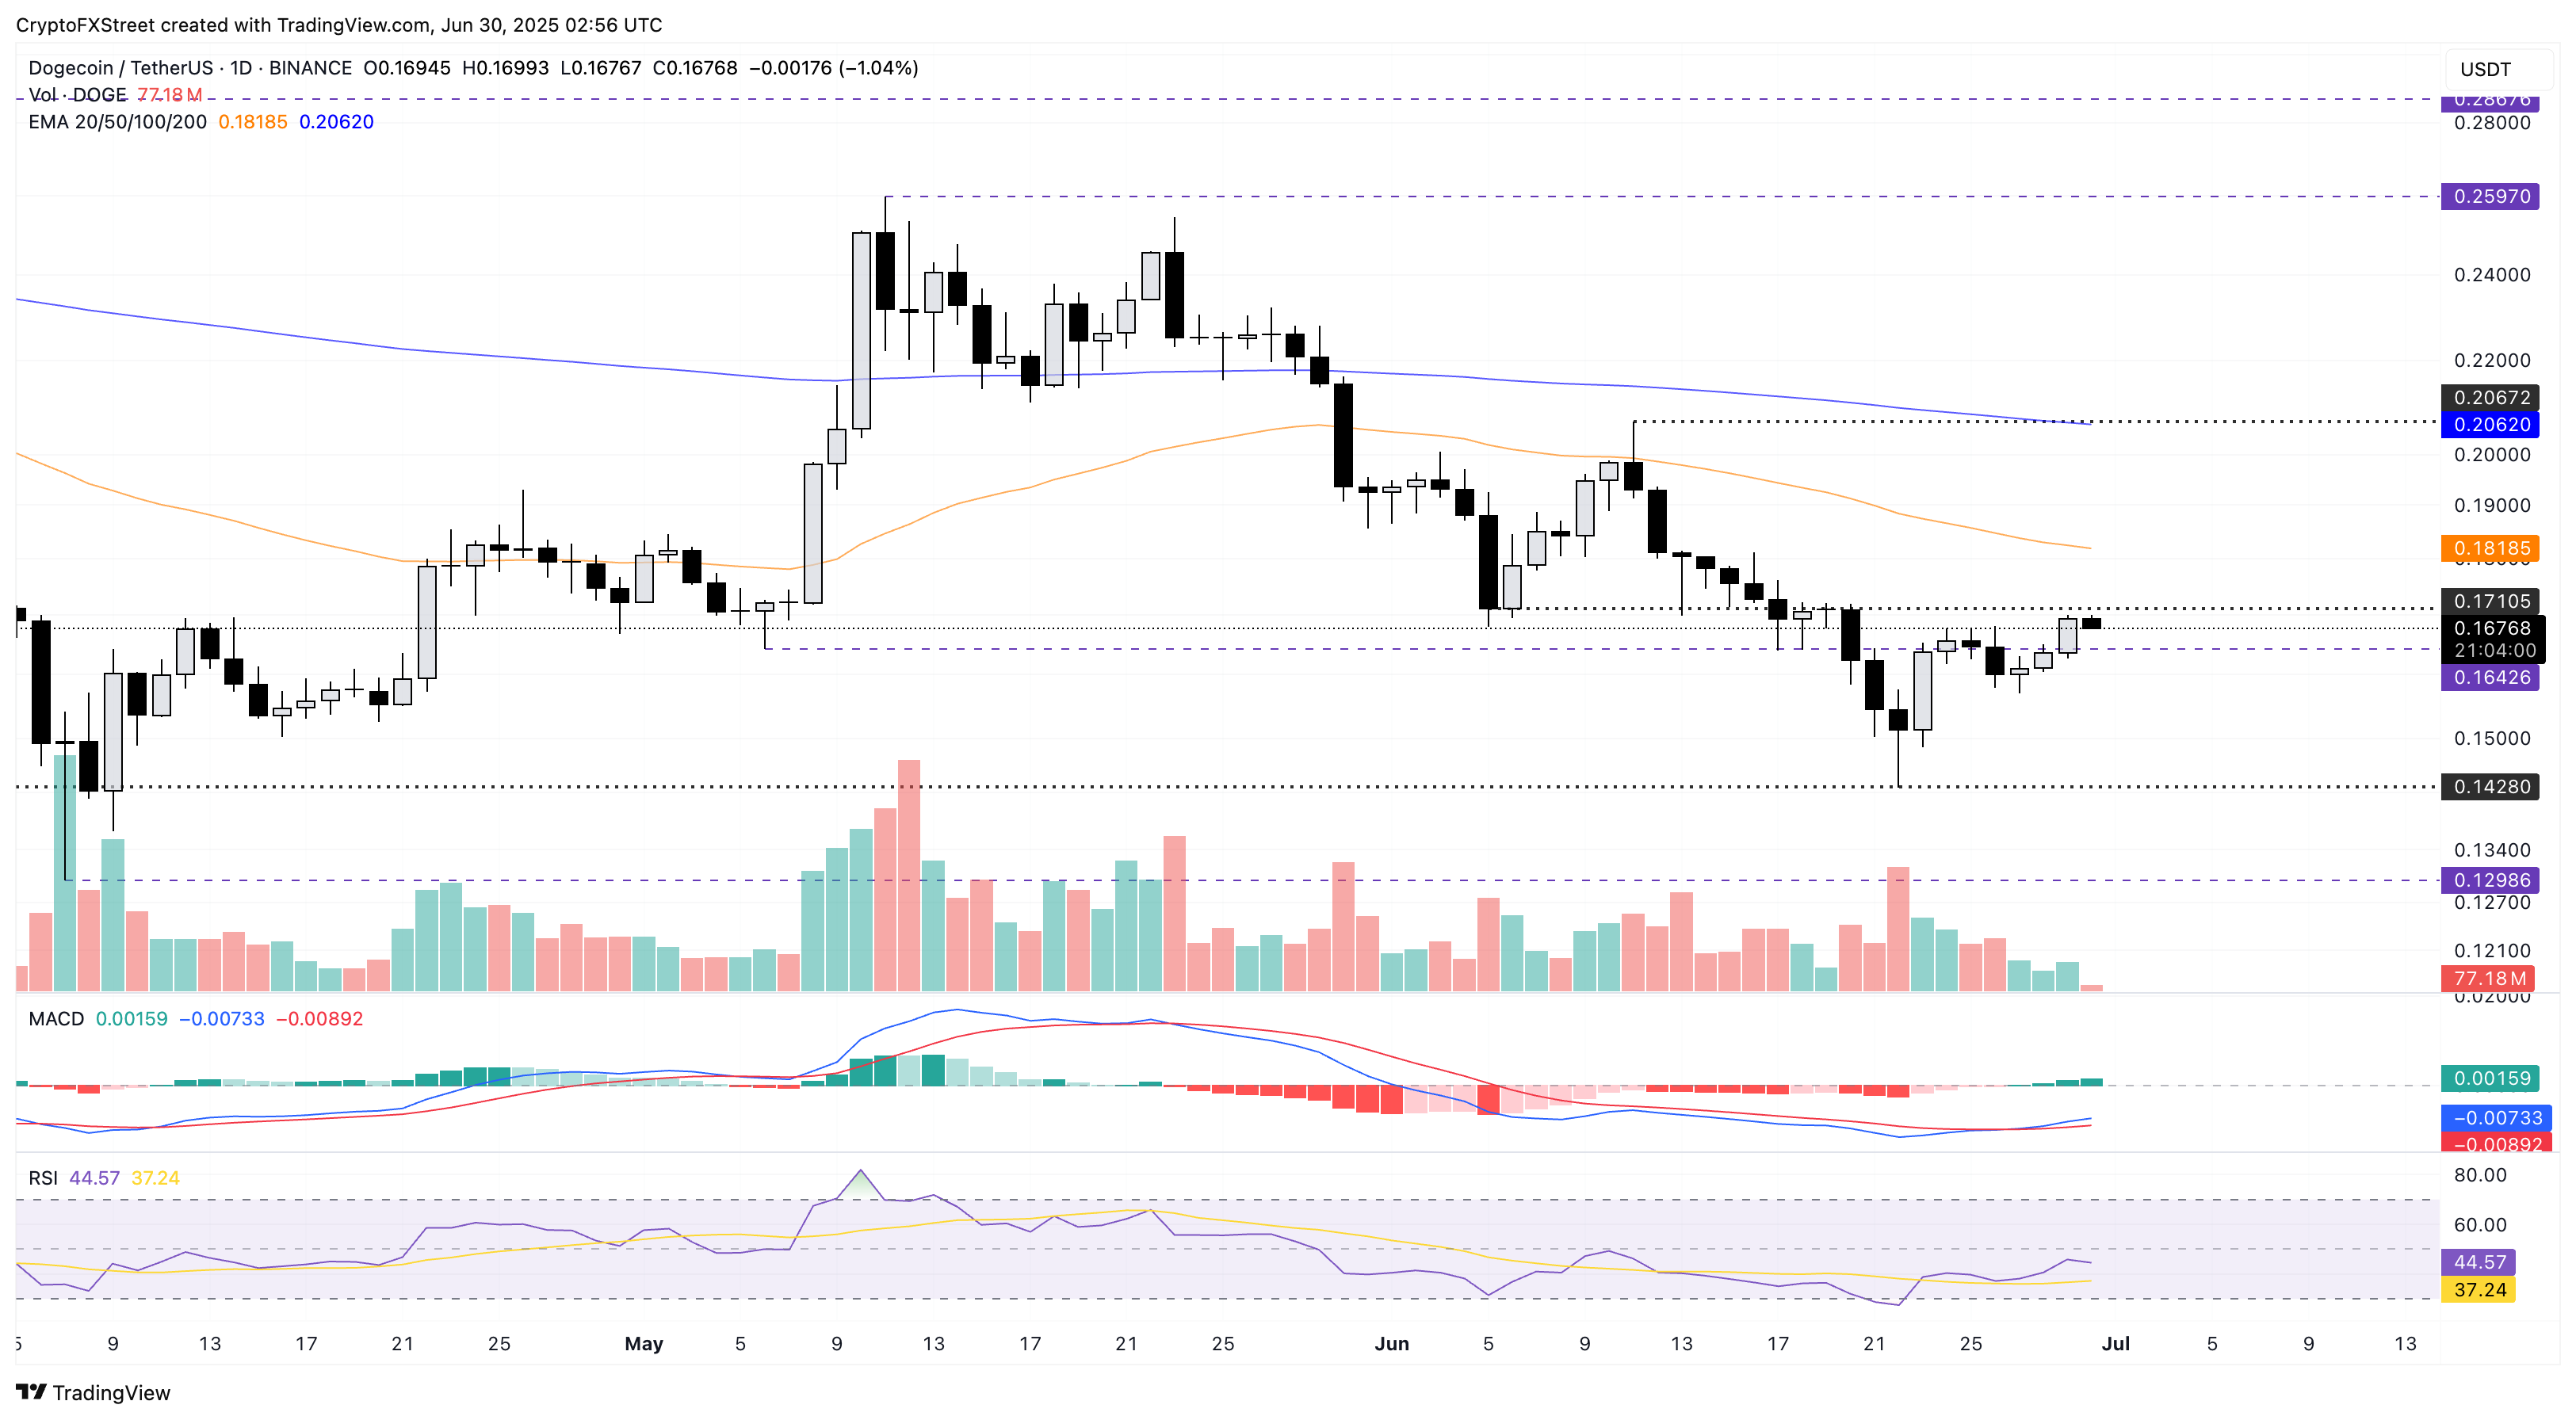
DOGE/USDT daily price chart.
A failure to surpass the $0.17 resistance could result in a retest of the $0.14 support, marked by the low on June 22.
Shiba Inu’s trendline breakout rally lags momentum
Similar to DOGE, Shiba Inu surged 12% last week, extending its recovery to challenge the $0.00001200 resistance marked by the June 5 closing price. At the time of writing, SHIB is down nearly 2% struggling to hold onto the 2.77% surge from Sunday.
Further up, the meme coin crosses above a resistance trendline formed by the highest prices on May 12, May 23, and June 11, suggesting a trend reversal. A potential close above the $0.00001200 resistance could extend the SHIB recovery to the 50-day Exponential Moving Average (EMA) at $0.00001252.
The MACD indicator displays a streak of rising green histogram bars from the zero line, suggesting an uptrend in motion.
The RSI at 45 bounces off the oversold boundary, indicating a diminishing bearish influence.
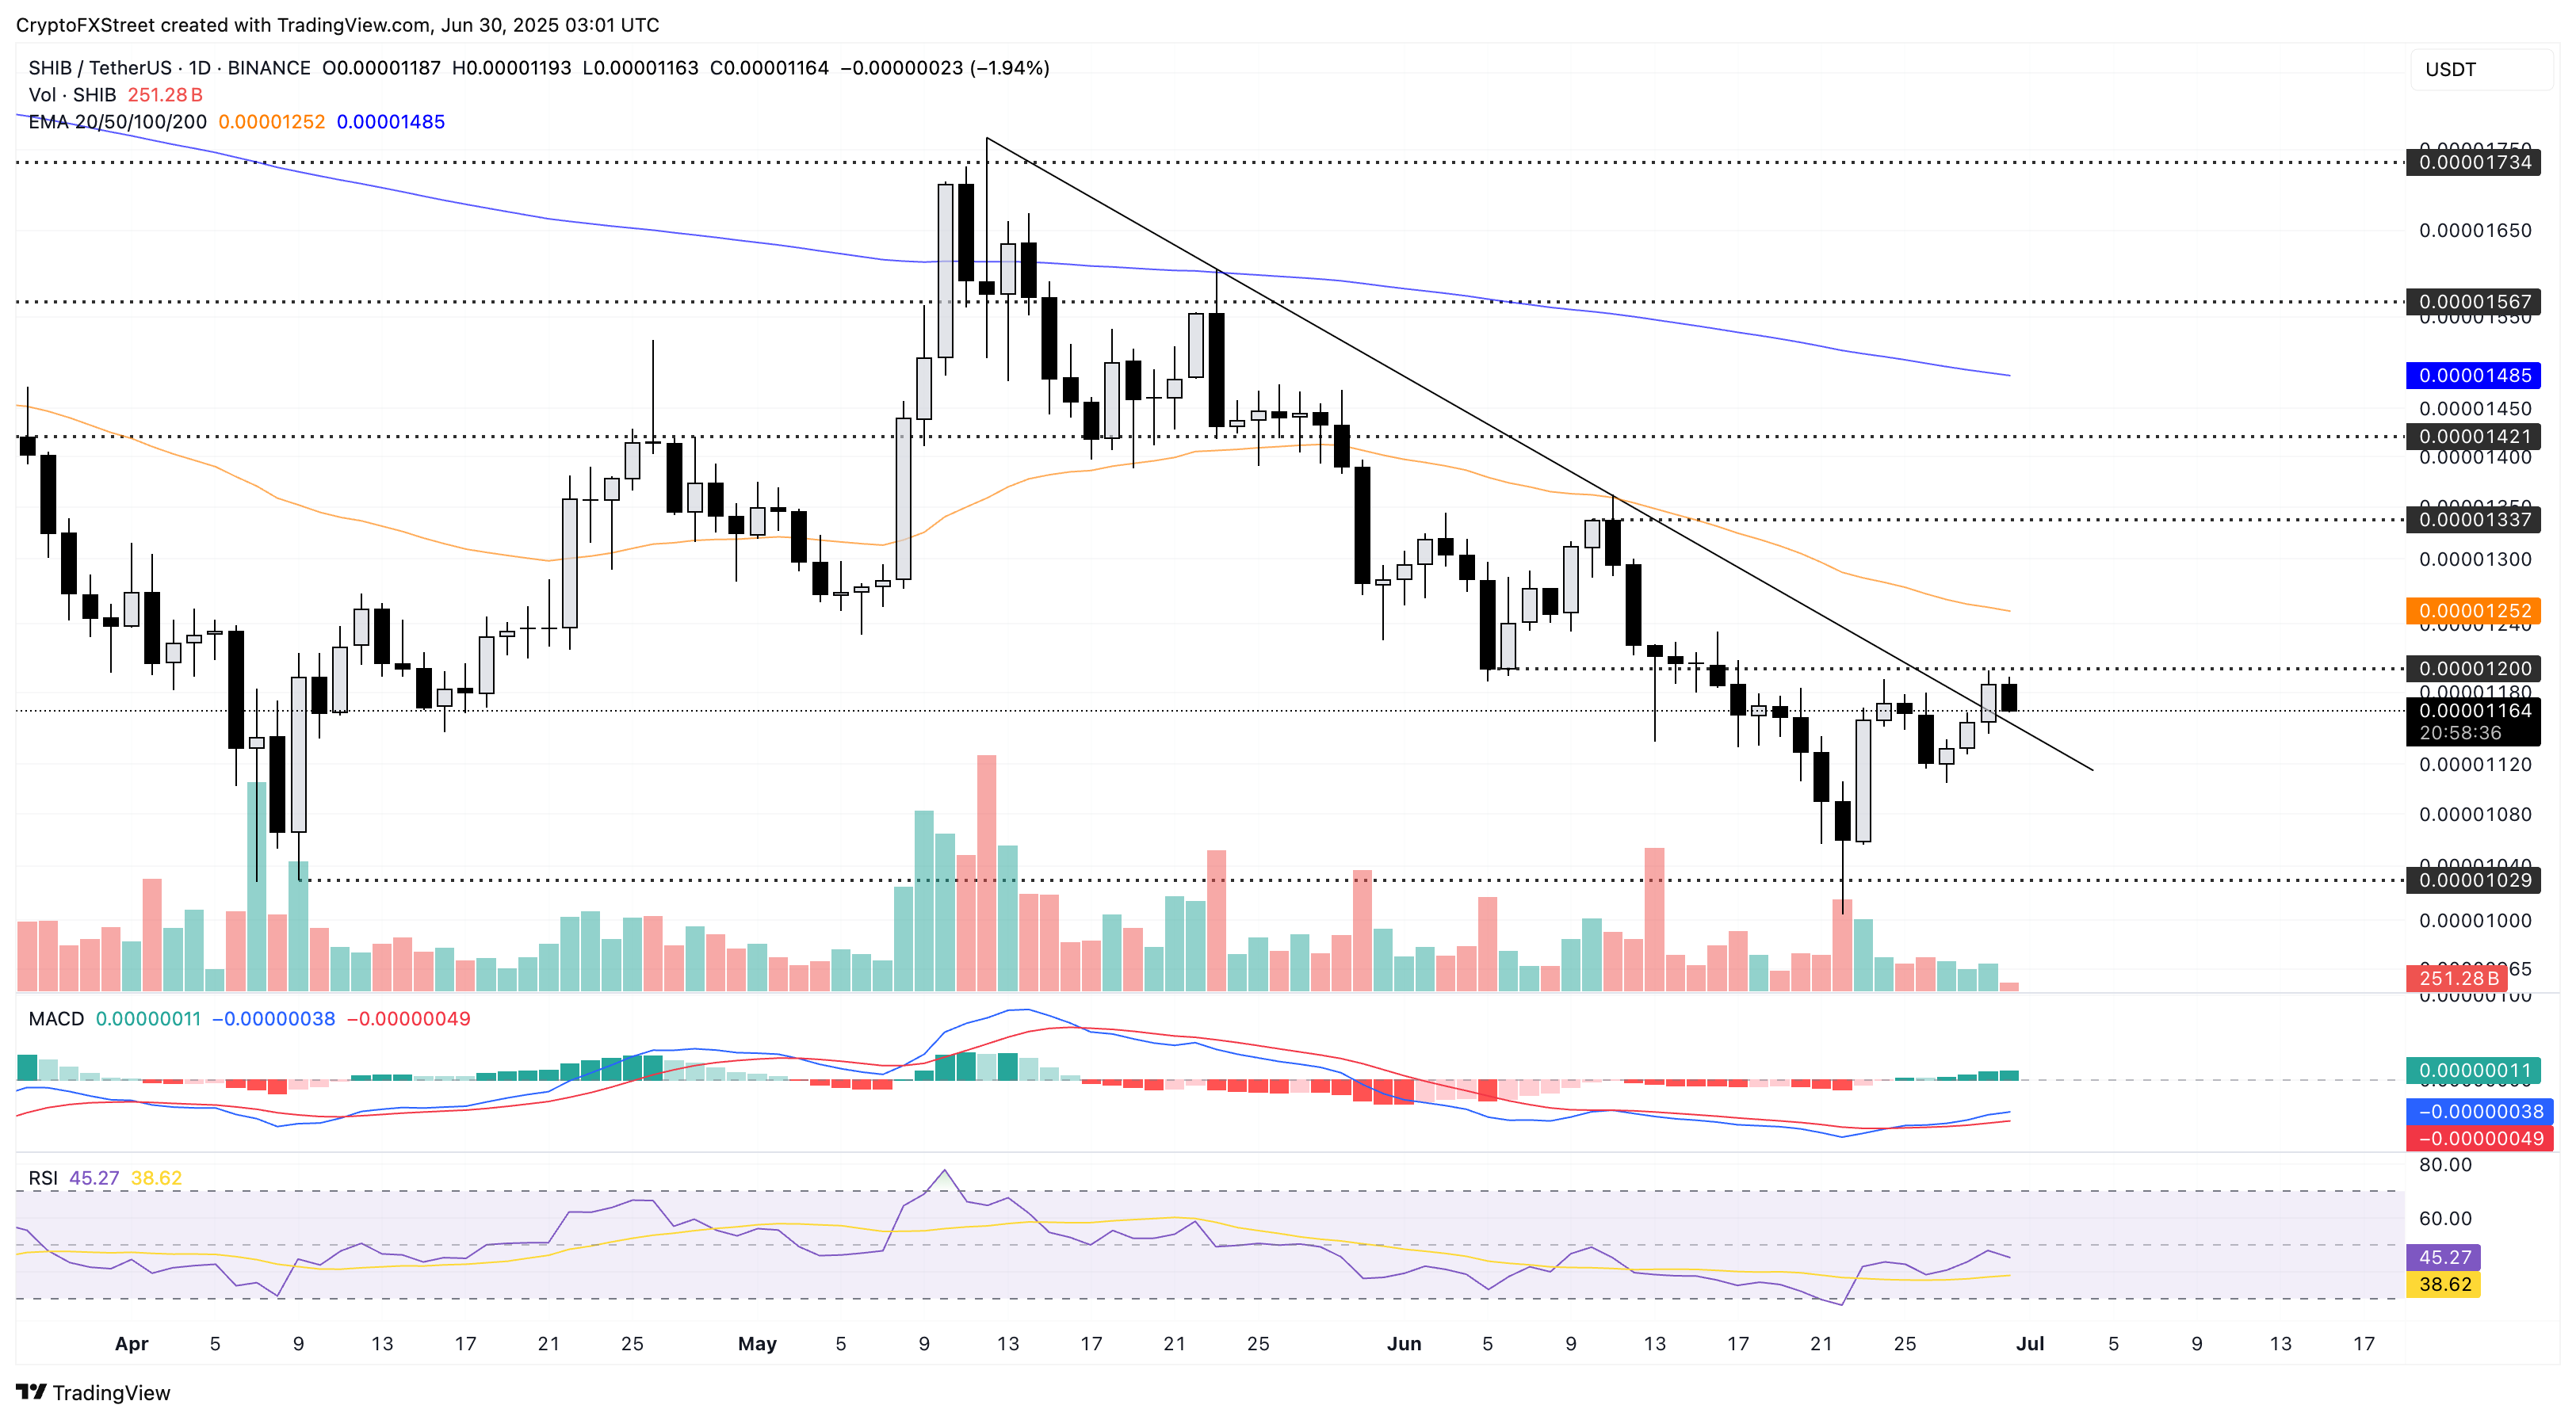
SHIB/USDT daily price chart.
A bearish close below Sunday’s opening price of $0.00001155 would nullify the trendline breakout rally. In such a case, SHIB could target the $0.00001000 psychological support level.
Pepe struggles to overcome a resistance trendline
Pepe ticks lower 2% at press time as the buying pressure softens following the 8.90% jump on Sunday. Despite a 17% return last week, meme coin struggles to overcome a critical resistance trendline marked by the swing highs on May 23 and June 10.
A clear push above the trendline could test the $0.00001196 marked by the lowest price on May 17.
The MACD indicator triggers a trend reversal with the MACD line crossing above its signal line on Sunday. The RSI is at 46 inches closer to the midpoint, indicating a neutral playfield as the bearish pressure declines.
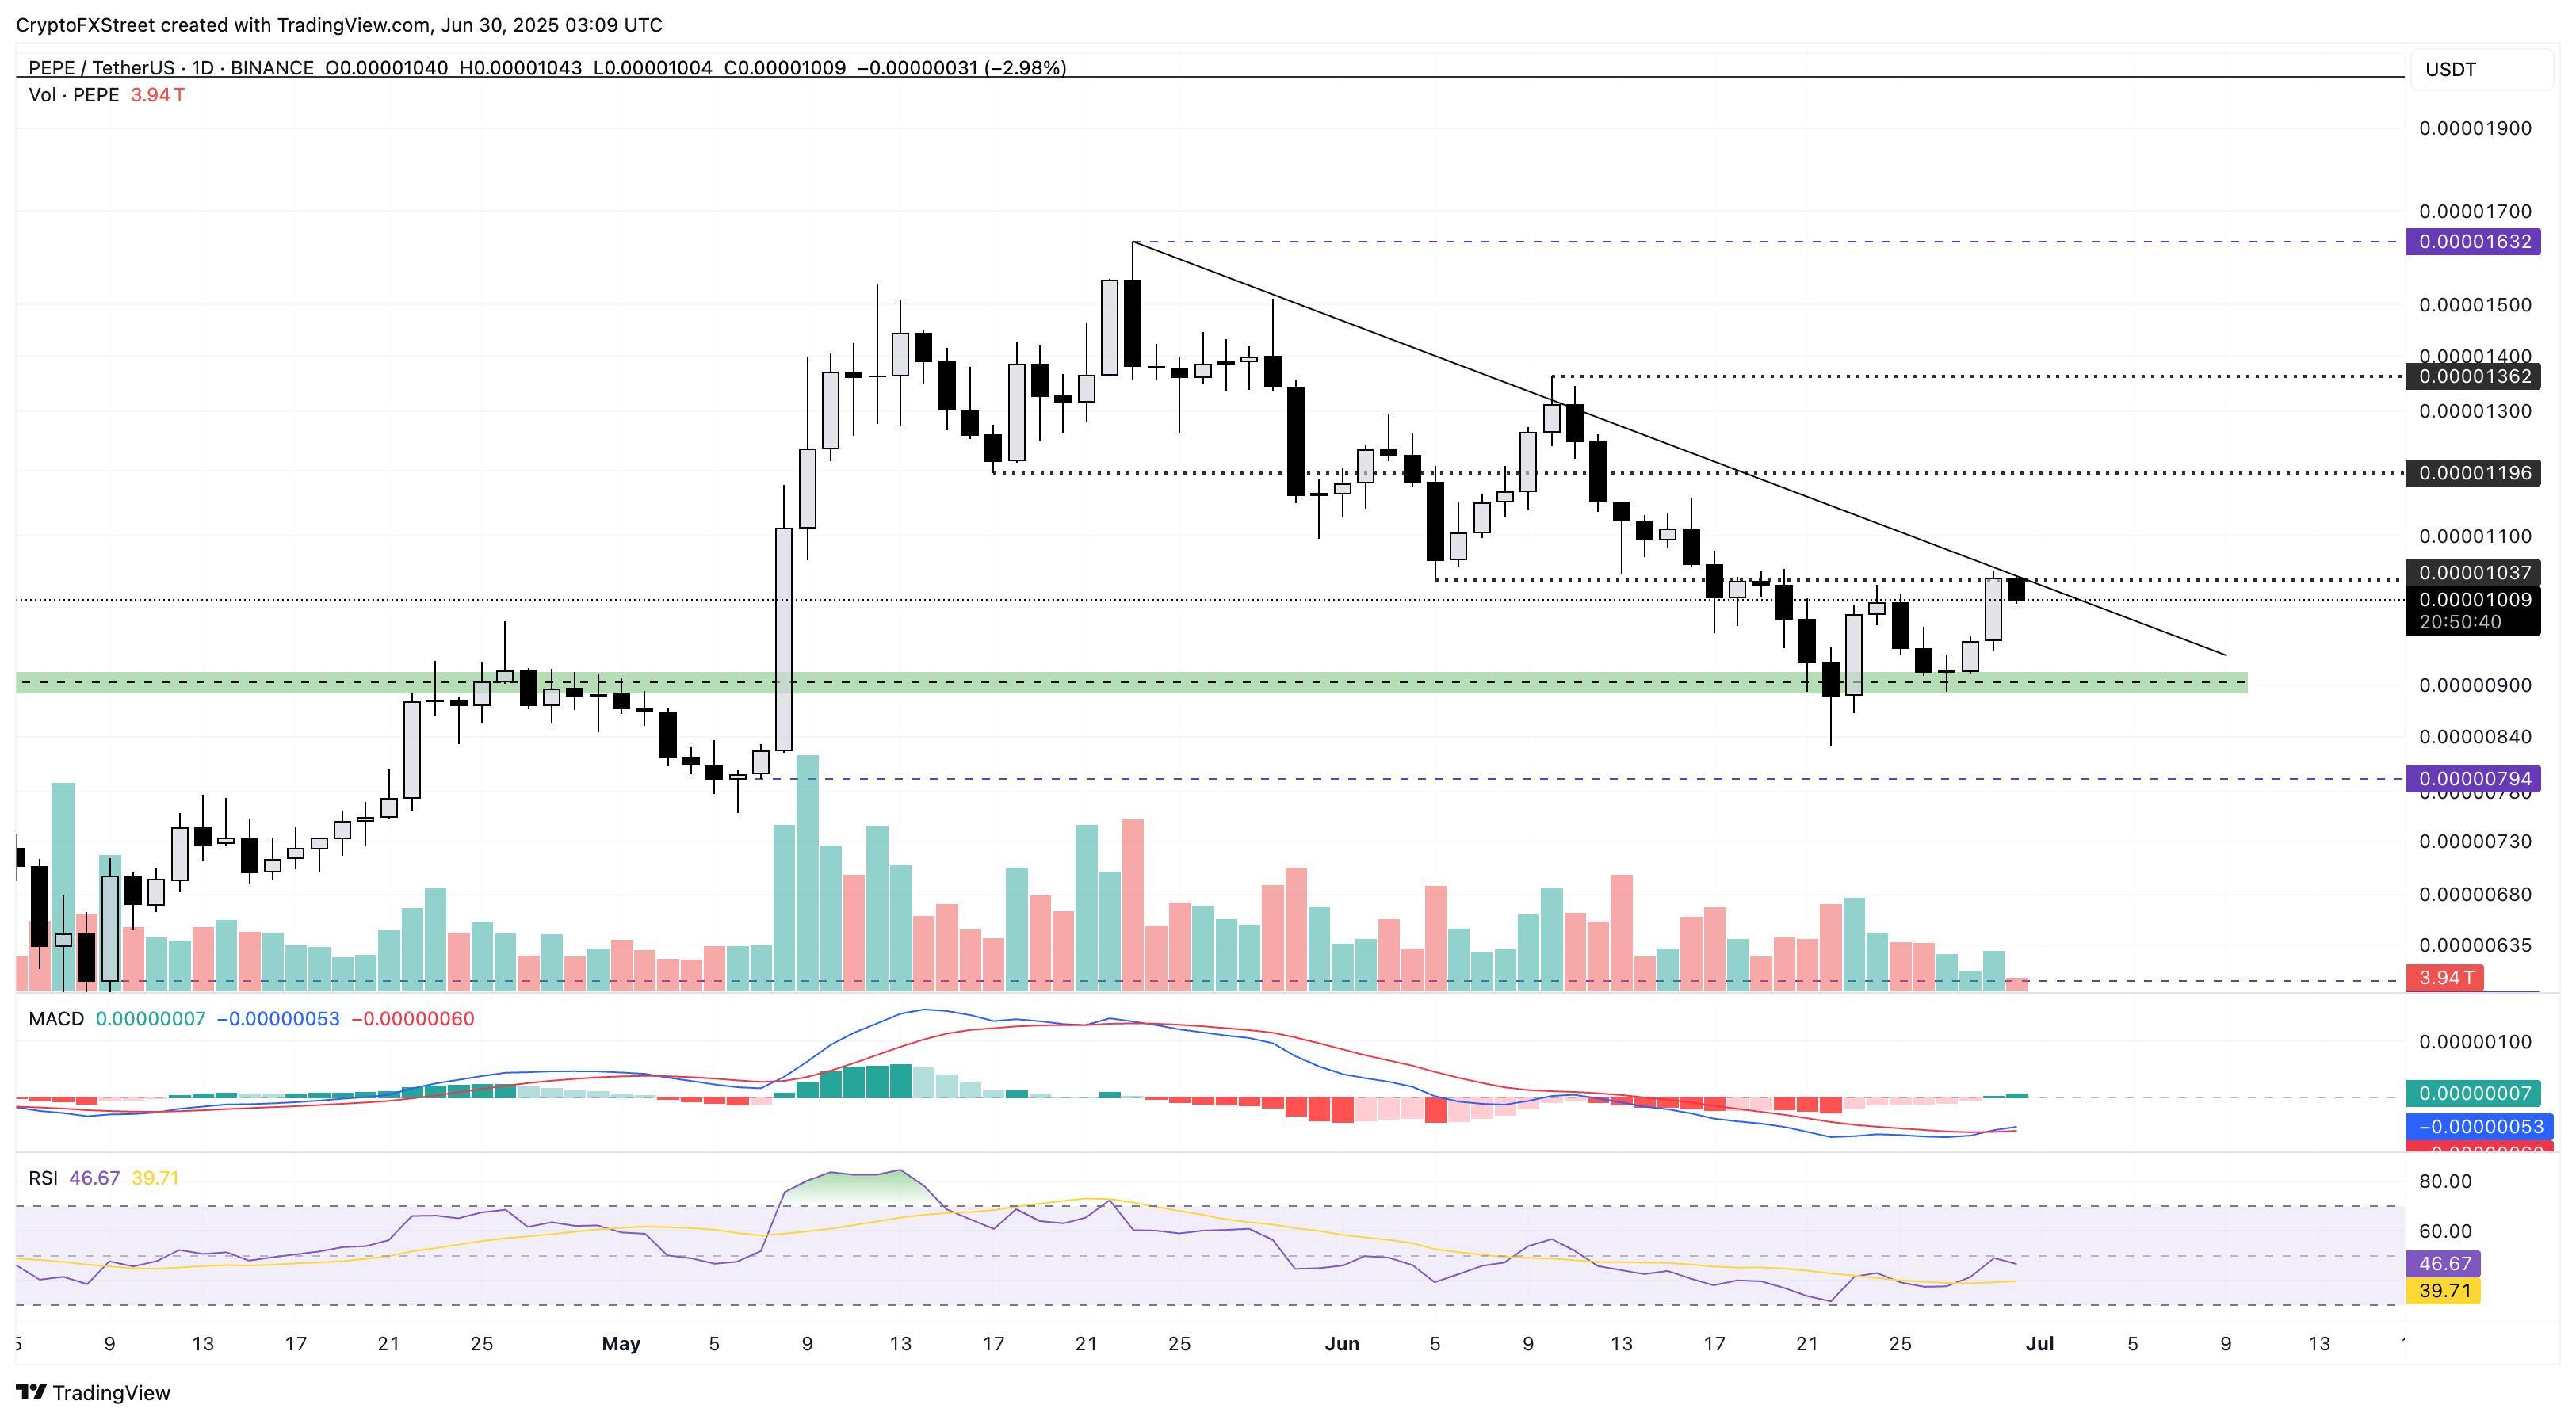
PEPE/USDT daily price chart.
However, a negative close could retest the $0.00000900 support zone last tested on Friday.
* The content presented above, whether from a third party or not, is considered as general advice only. This article should not be construed as containing investment advice, investment recommendations, an offer of or solicitation for any transactions in financial instruments.


