
Dogwifhat Price Forecast: WIF looks to extend gains amid increasing Social Dominance score
- Dogwifhat holds above the 50-day and 100-day EMAs on Monday following a 4.82% jump from the previous day.
- The Social Dominance score reaches a new high since mid-May, indicating an increased buzz surrounding Dogwifhat.
- The derivatives data signals heightened buying activity amid increasing Open Interest and OI-weighted funding rate.
Dogwifhat (WIF) edges lower towards recently reclaimed dynamic support levels, trading at $0.85 at the time of writing on Monday. The social dominance and derivative data suggest a bullish bias, hinting at further gains ahead. At the same time, the technical outlook suggests a potential broadening wedge pattern that may be nearing a conclusion.
Bearish sentiment declines amid rising social chatter
Santiment’s social dominance score for Dogwifhat reaches 0.327%, a new high since mid-May, indicating an increase in social chatter around WIF. The metric relates to the percentage share of media discussions of Dogwifhat.
Additionally, the weighted sentiment total rose to -0.176 on Sunday from the -0.305 bottom on Saturday, indicating a decline in bearish sentiment. If the weighted sentiment total flips positive, it will mark greater bullish sentiment surrounding WIF compared to bearish sentiment.
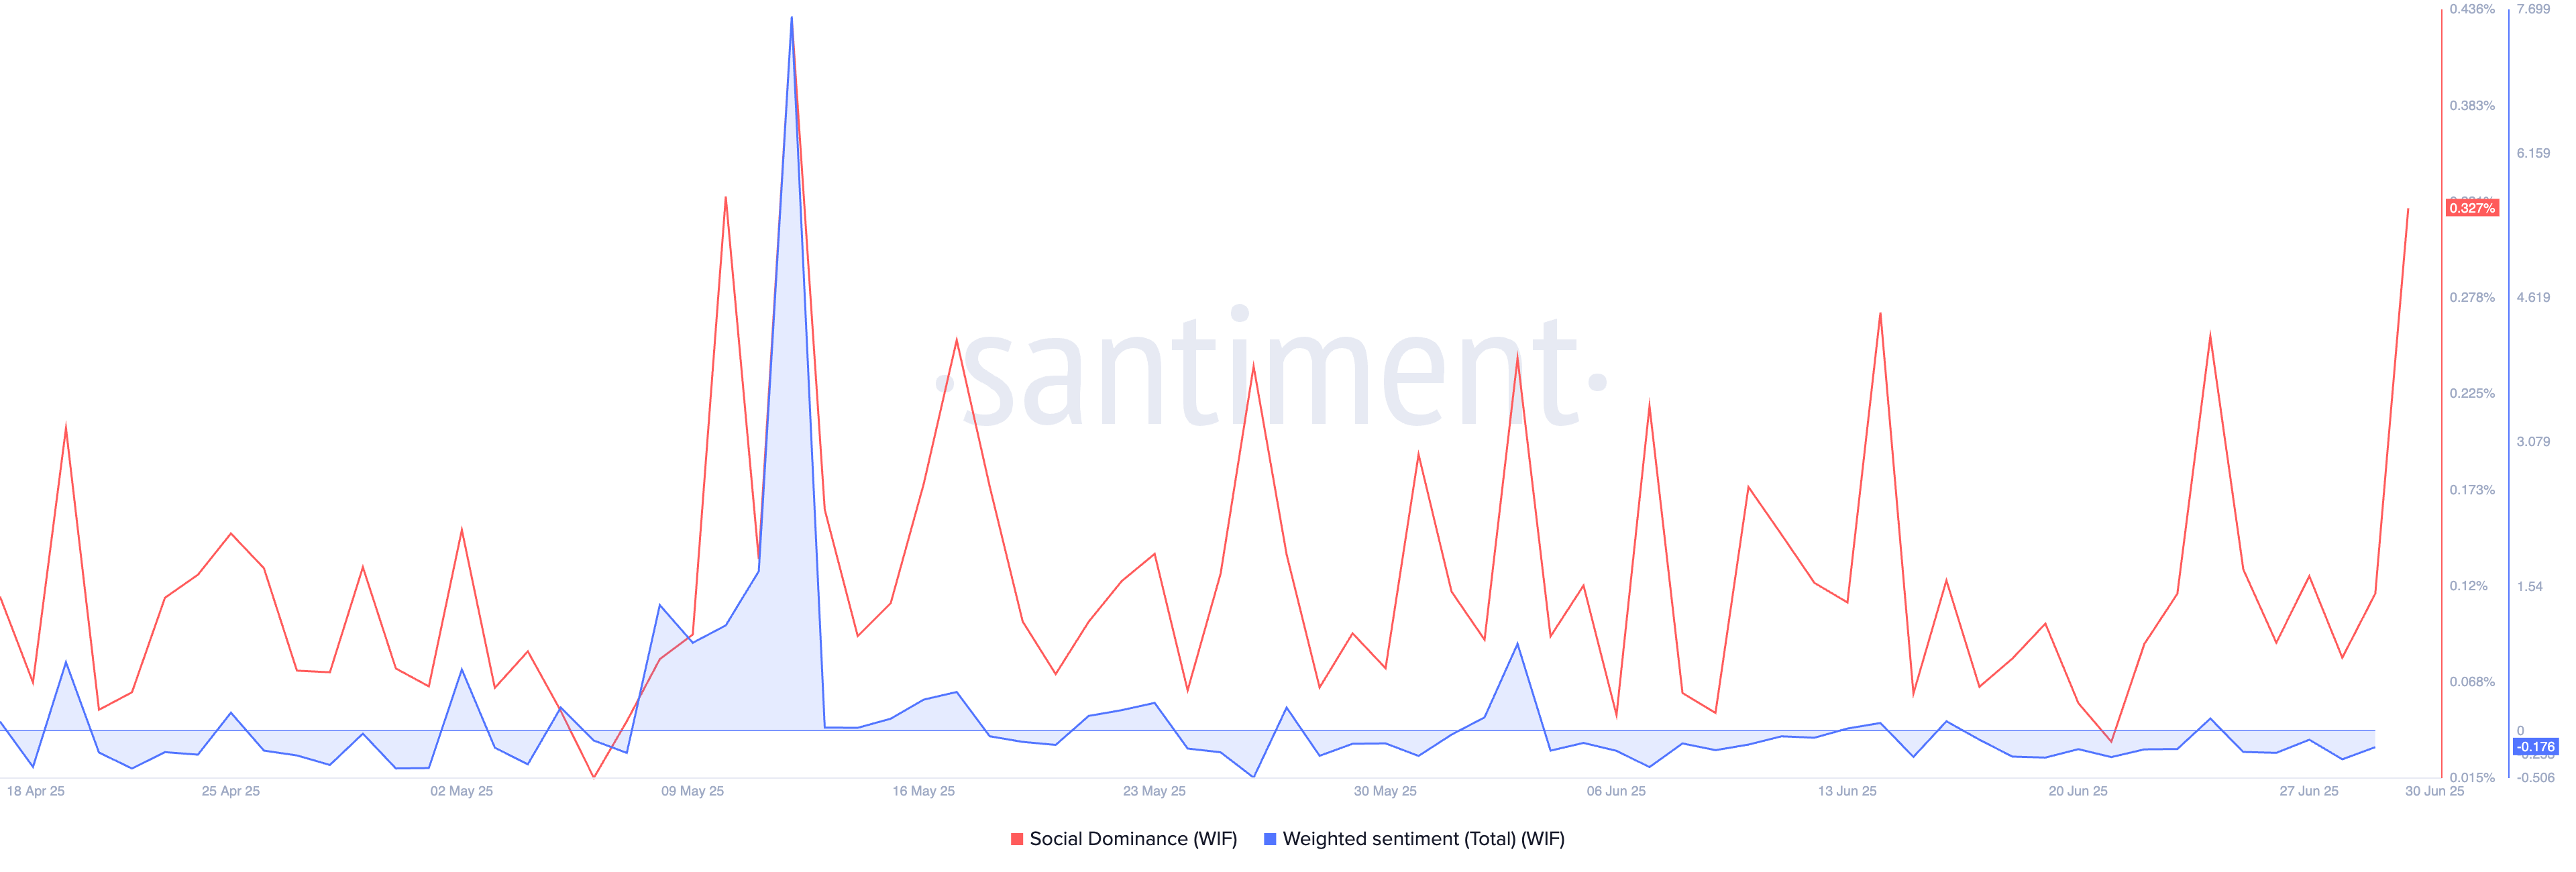
WIF social dominance. Source: Santiment
Optimistic traders boost WIF Open Interest
CoinGlass’ data shows the WIF Open Interest (OI) reaching $379.54 million with a 7.41% surge in the last 24 hours. An OI surge indicates new or increased buying in the derivatives market, suggesting improved optimism.
The OI-weighted funding rate flips positive to 0.0052%, indicating that trading activity shifts from selling dominance to buying dominance. Funding rates are imposed on traders with dominant sentiment to negate the imbalance in spot and swap prices.
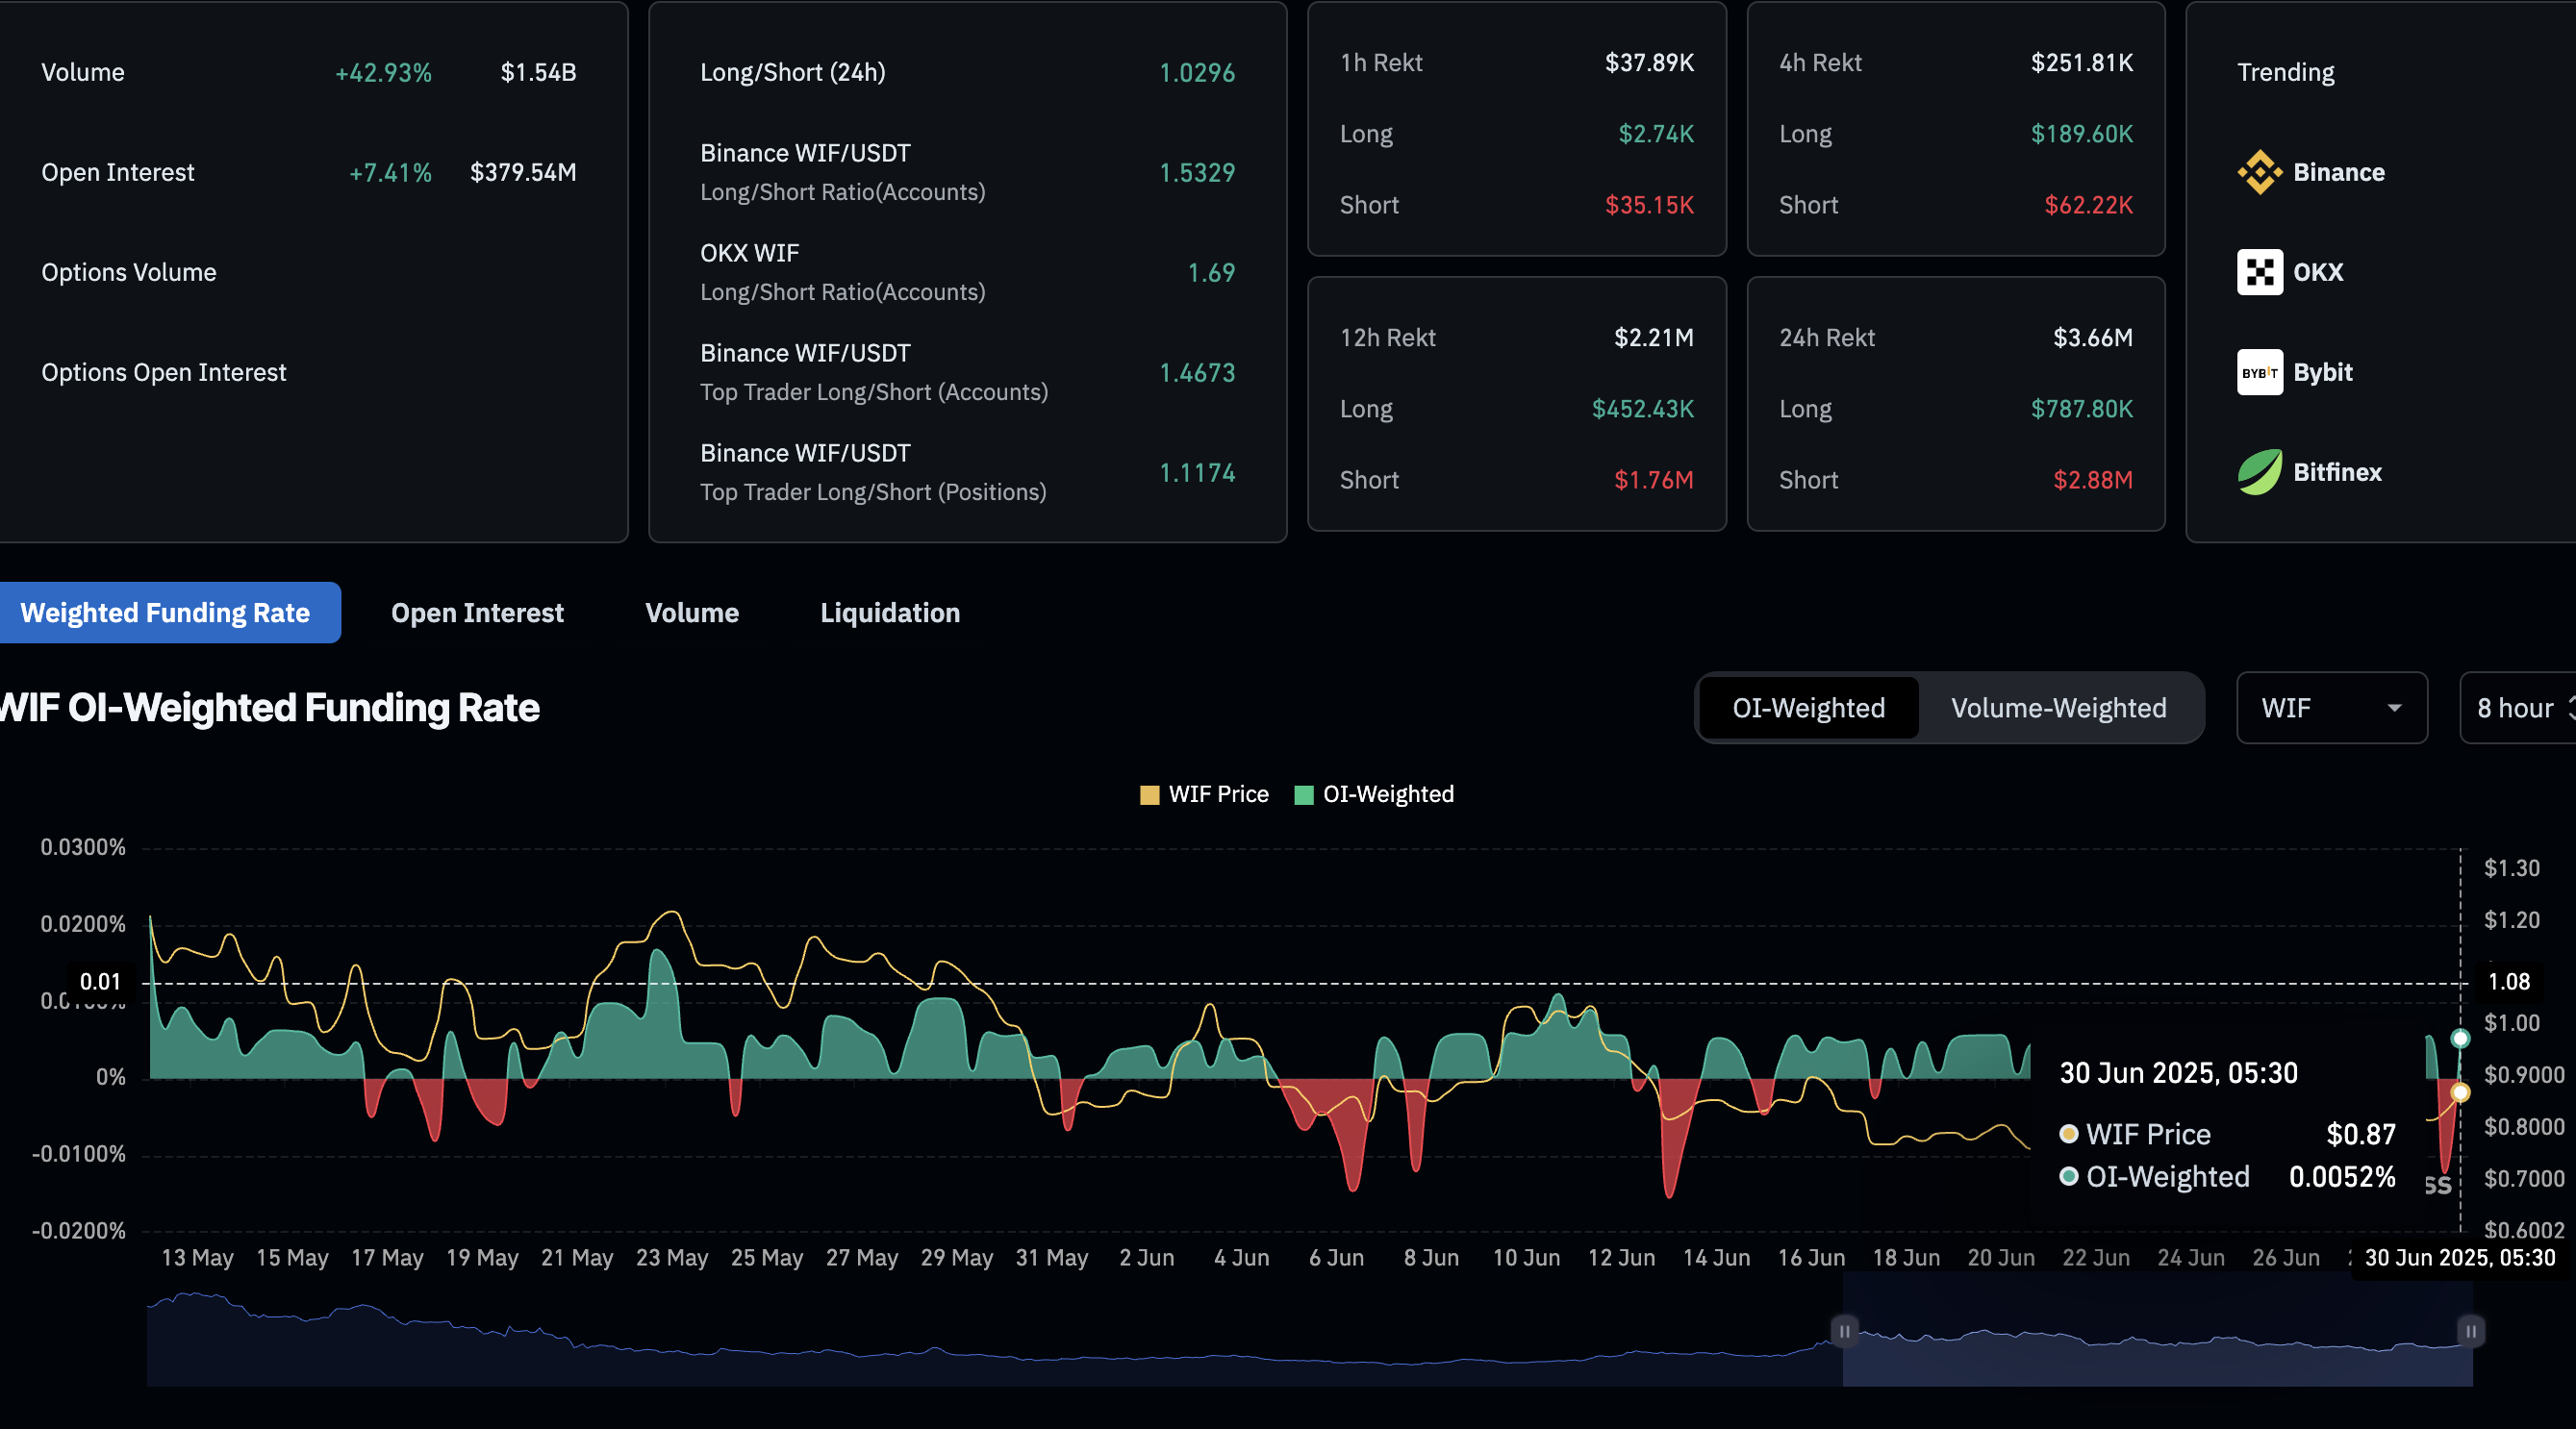
Dogwifhat derivatives data. Source: Coinglass
Dogwifhat plots a broadening wedge pattern breakout
Dogwifhat trades in the red by 1% at press time on Monday as it struggles to hold the 4.82% surge from the prior day. Despite the pullback, WIF holds above the dynamic support levels of the 50-day and 100-day Exponential Moving Averages (EMAs), at $0.83 and $0.84, respectively.
As the support holds firm at present, WIF could target an overhead resistance trendline formed by the peaks on May 12, May 29, and June 10. It is worth noting that the overhead trendline completes a descending broadening wedge pattern combined with a support trendline connected by the lowest prices on May 15, May 31, and June 22.
Typically, the pattern concludes in a bullish outcome, increasing the upside chances for Dogwifhat. If WIF closes above the overhead trendline at $0.92, it could test the 200-day EMA at $1.08.
The Relative Strength Index (RSI) at 52 takes a sideways shift near the midline after bouncing back from close to the oversold boundary line on June 22, suggesting a boost in buying pressure.
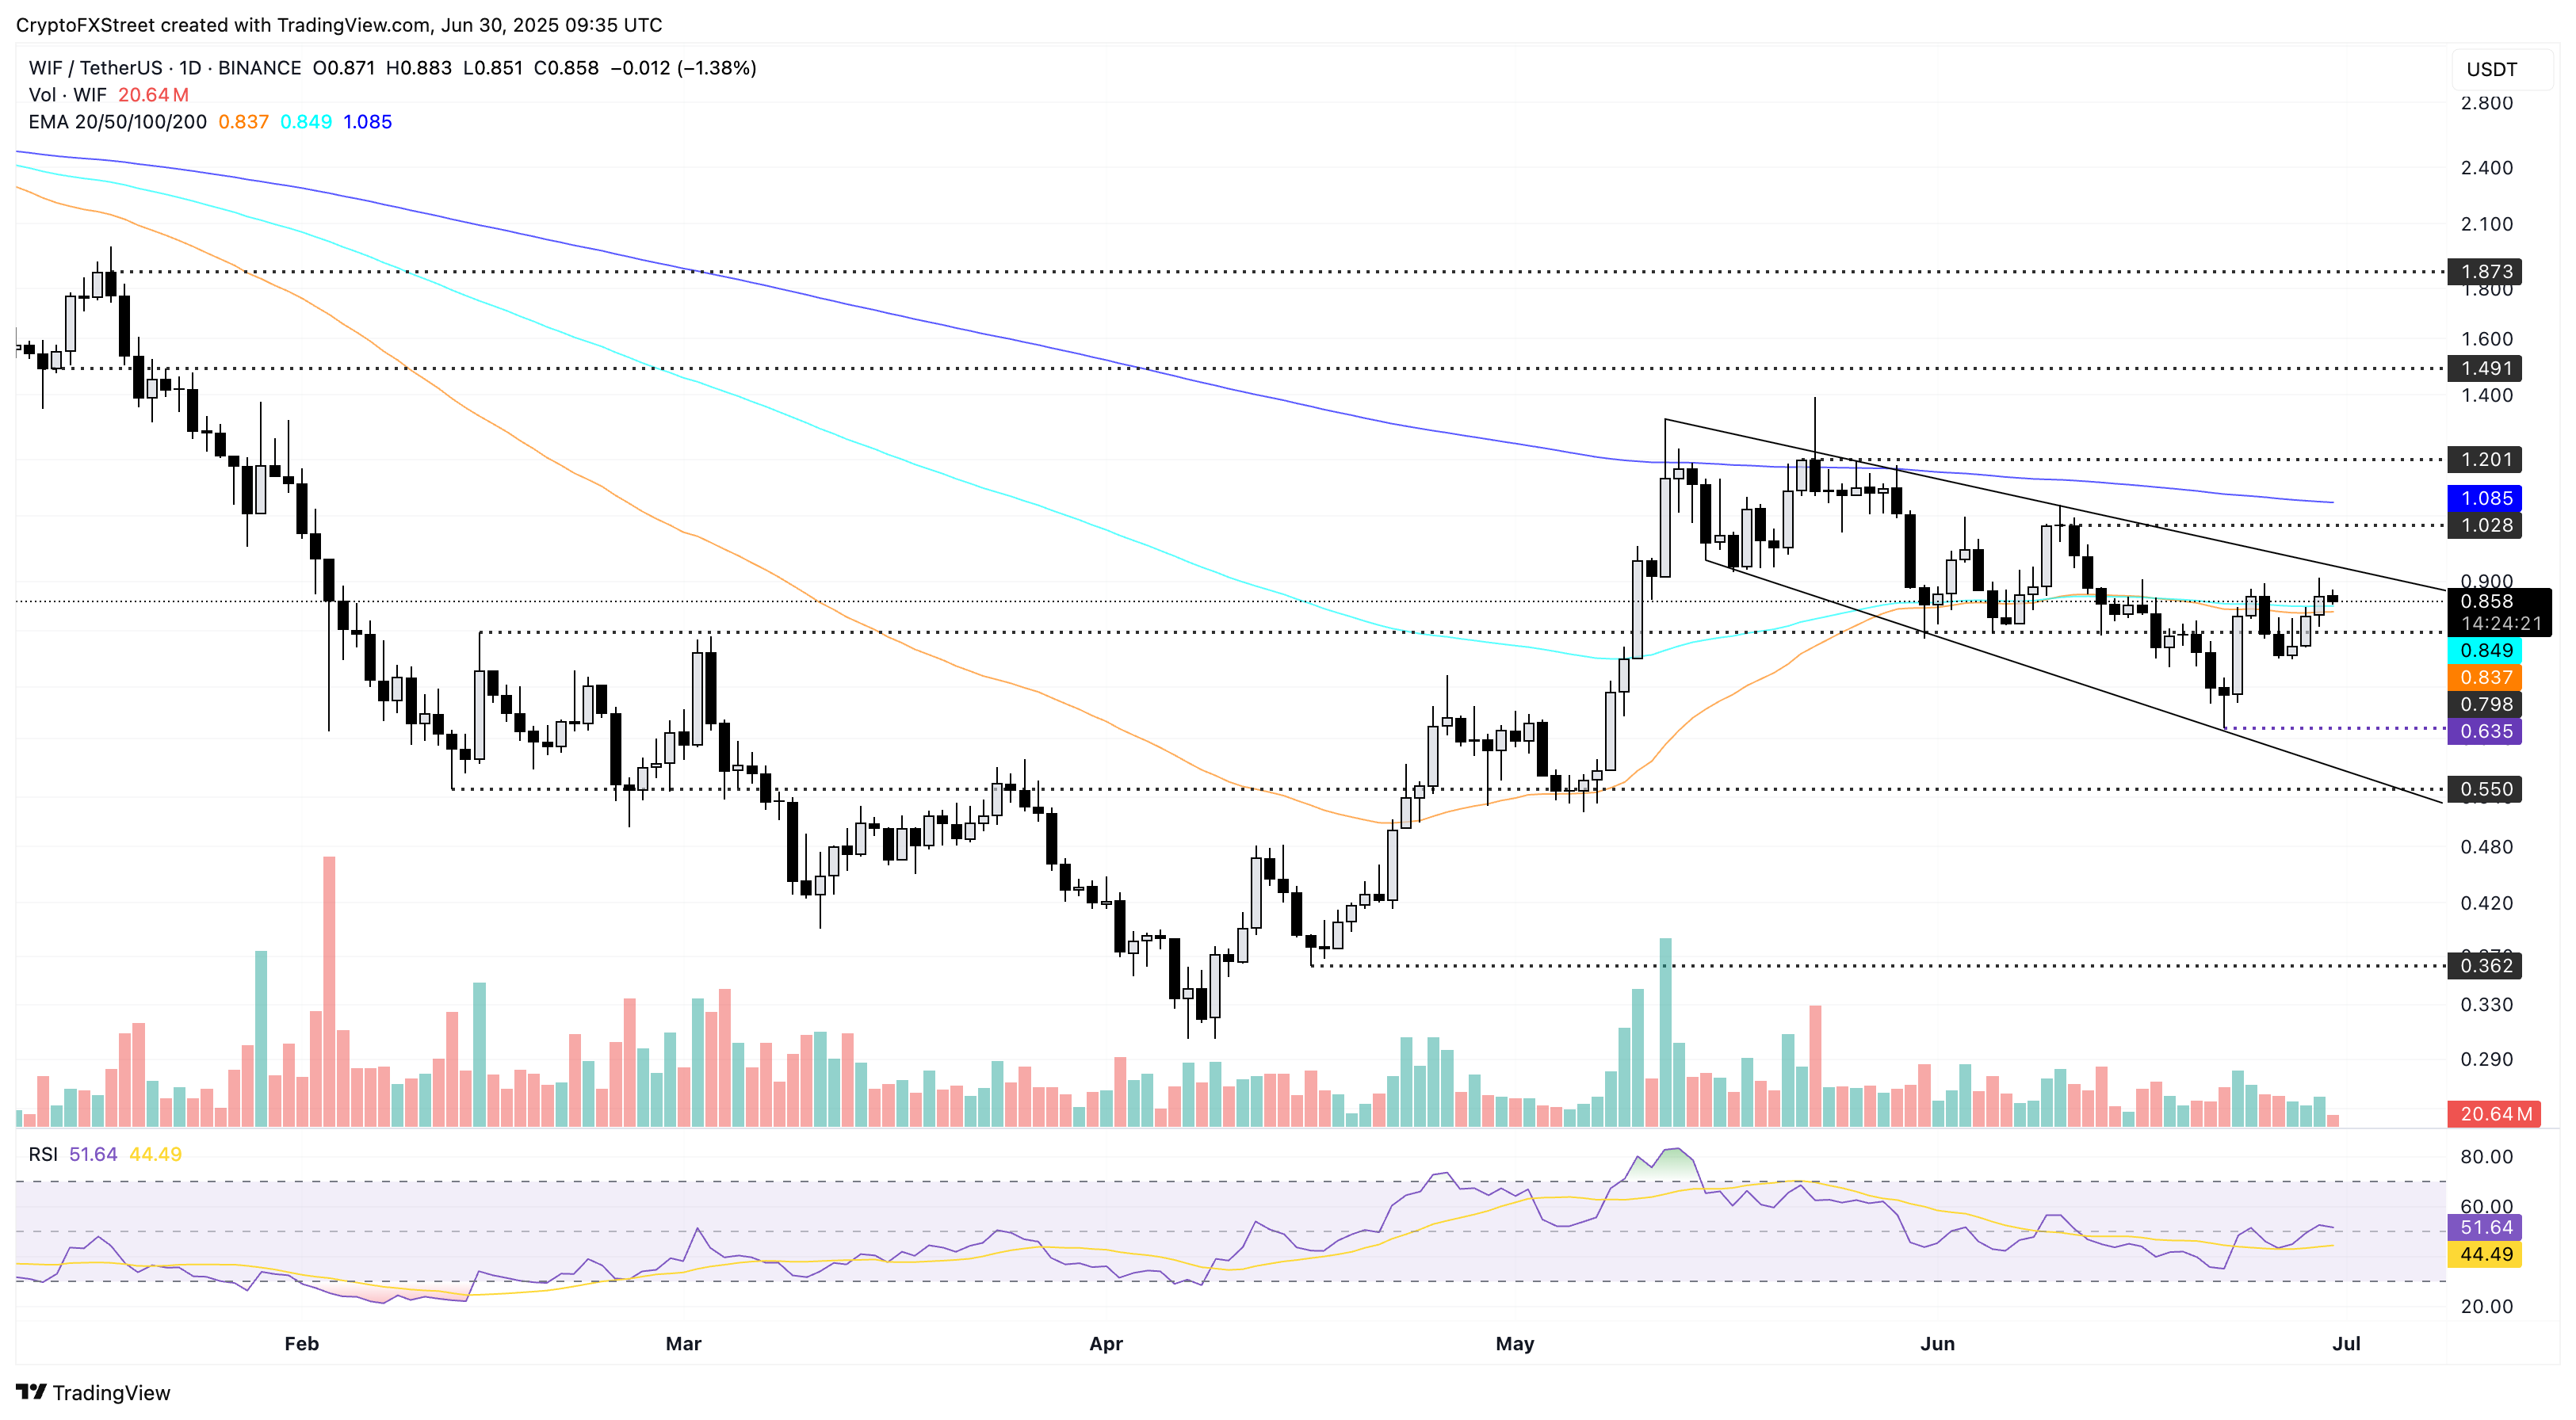
WIF/USDT daily price chart.
However, if WIF fails to hold above the 50-day EMA at $0.83, it could test the previous dip on June 22 at $0.63.
Recommended Articles


