

Bitcoin, Solana Realized Cap Growth Slows—But Ethereum Still Accelerating
- Gold Price Forecast: Gold Poised to Break $4,200 as Oil Price Slump Eases Inflation Fears
- Gold Price Forecast: Oil Price Breaking $100 Fuels Inflation Concerns, Will Gold Prices Fall Further?
- Gold Price Trend Forecast: Expectations of Easing US-Iran Tensions Boost Gold Prices, $4,070 Becomes Key Level for Bulls and Bears
- Gold rallies to over two-week high, eyes $4,150 as traders track US-Iran diplomacy efforts
- Middle East War updates: US-Iran pause strikes as Trump weighs up diplomatic options
- Euro declines to near 1.1400 as US launches fresh strikes on Iran
On-chain data reveals capital inflows into Bitcoin and Solana have slowed over the past week, while Ethereum’s growth has been resilient.
Realized Cap Shows Divergence Between Ethereum & Bitcoin
In a new post on X, on-chain analytics firm Glassnode has discussed about how the Realized Cap has changed for some of the assets in the cryptocurrency sector. The “Realized Cap” refers to a capitalization model that calculates a given coin’s total value by assuming the ‘true’ value of each token in circulation is the spot price at which it was last involved in a transaction.
In short, what this indicator represents is the total amount of capital that the investors of the cryptocurrency as a whole have stored into it. Changes in its value, therefore, correspond to the inflow or outflow of capital.
Below is the chart shared by Glassnode that shows the 30-day percentage change in the Realized Cap for a few different digital assets.
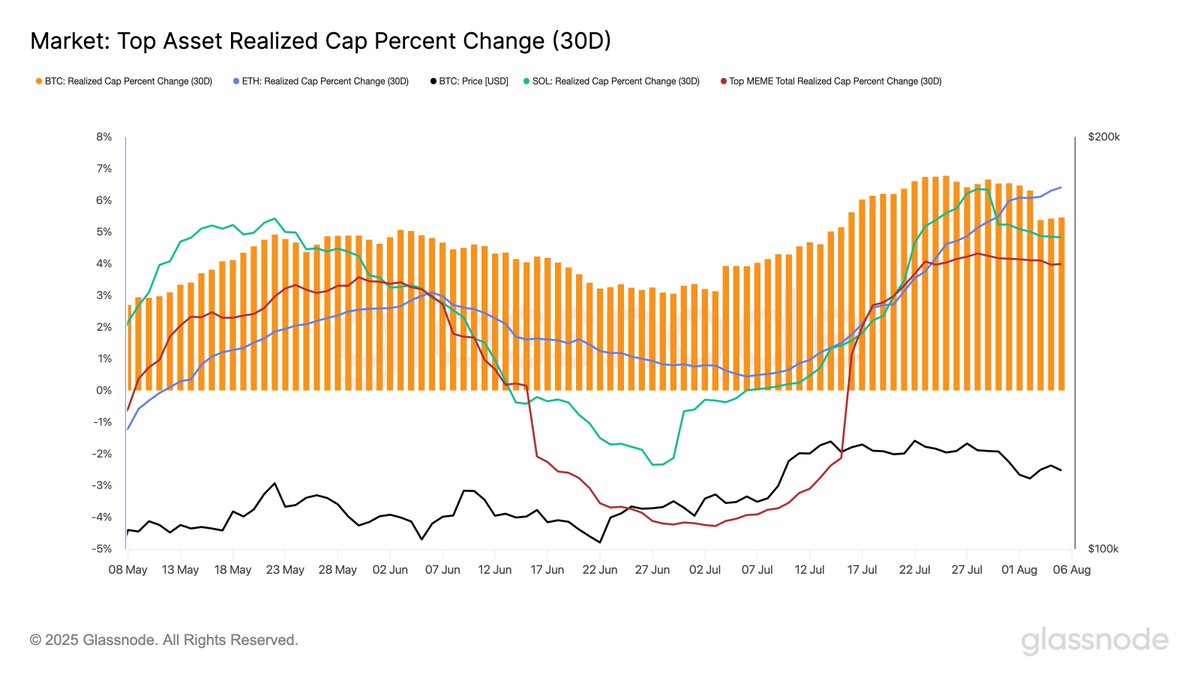
From the graph, it’s visible that the monthly change in the Realized Cap is currently positive for all four of Bitcoin, Ethereum, Solana, and the top memecoins. This suggests that capital has flowed into the market over the last 30 days.
Though, while this is true, BTC and SOL have been showing a shift in the short term. One week ago, the Realized Cap change for them stood at 6.66% and 6.34%, respectively. But today, the metric’s value has come down to 5.46% and 4.84%. Still notably positive, of course, but does reflect a slowdown in demand.
Interestingly, while these two tokens have witnessed this trend, ETH has continued its Realized Cap growth with the percentage change jumping from 5.32% to 6.41%. This may be an indication that capital is rotating from other assets into the token number two by market cap.
The top meme-based tokens have seen a flat trend in the indicator during the past week, which, according to the analytics firm, is another sign of “cooling risk appetite.”
In some other news, both the largest and smallest of investors on the Bitcoin network have been accumulating at the same time recently, as Glassnode has pointed out in another X post.
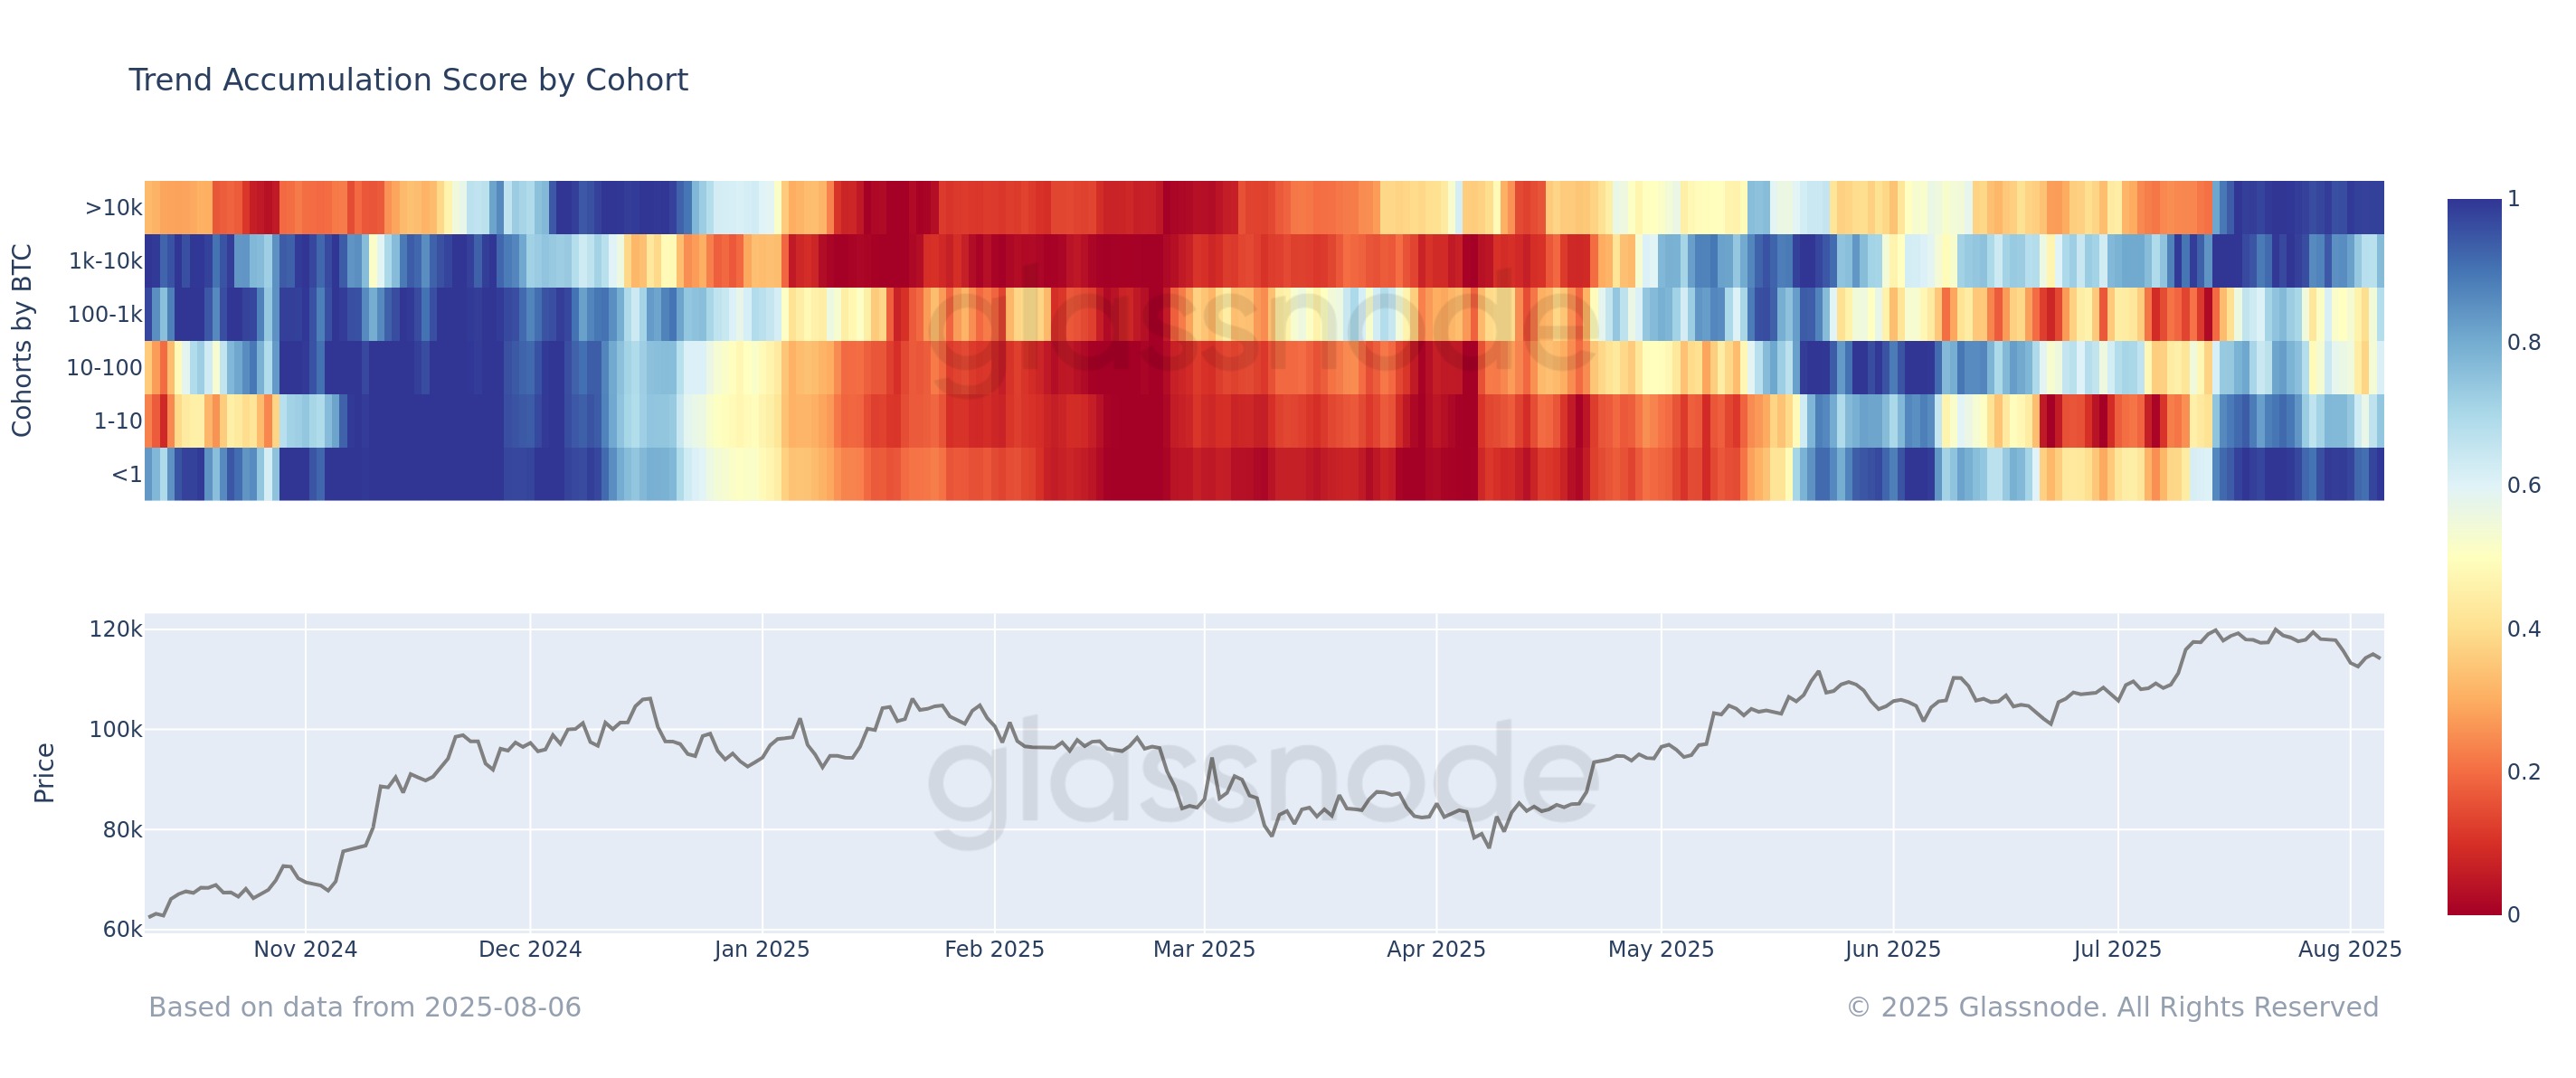
In the chart, the data of the “Accumulation Trend Score” is shown, which tells us about whether Bitcoin investors are accumulating or distributing. A value close to 1 implies dominant buying, while a value near 0 suggests selling pressure.
As is apparent from the graph, the metric’s value has been pretty close to 1 for both below 1 BTC and above 10,000 BTC investors. “This suggests initial dip-buying during the recent correction,” notes the analytics firm. That said, Glassnode also cautions that the signal is lagging, with investor behavior smoothed over a 15-day window.
BTC Price
At the time of writing, Bitcoin is floating around $115,100, down over 2% in the last seven days.
Read more
* The content presented above, whether from a third party or not, is considered as general advice only. This article should not be construed as containing investment advice, investment recommendations, an offer of or solicitation for any transactions in financial instruments.


