

Stellar (XLM) Reclaims $13 Billion Market Cap With 16% Rise In 24 Hours

- Gold Price Forecast: Oil Price Breaking $100 Fuels Inflation Concerns, Will Gold Prices Fall Further?
- Gold Price Trend Forecast: Expectations of Easing US-Iran Tensions Boost Gold Prices, $4,070 Becomes Key Level for Bulls and Bears
- Gold rallies to over two-week high, eyes $4,150 as traders track US-Iran diplomacy efforts
- Euro declines to near 1.1400 as US launches fresh strikes on Iran
- Tesla Q2 Earnings Preview: Record Deliveries Fail to Hide Profit Pressure, Can Musk Rely on AI and Autonomous Driving to Unlock New Growth Space?
- WTI climbs above $87.00 as Middle East conflict threatens key choke points
Stellar (XLM) price has surged over 16% in the last 24 hours, recovering its $13 billion market cap and signaling strong bullish momentum. Technical indicators, including the RSI, Ichimoku Cloud, and EMA lines, suggest that XLM is positioned for further gains but faces potential resistance ahead.
The RSI remains in the overbought zone, highlighting heightened buying activity, while the recent Golden Cross and Ichimoku setup point to sustained upward momentum. Key levels such as the $0.47 resistance and $0.41 support will play critical roles in determining whether XLM continues its rally or faces a sharp correction.
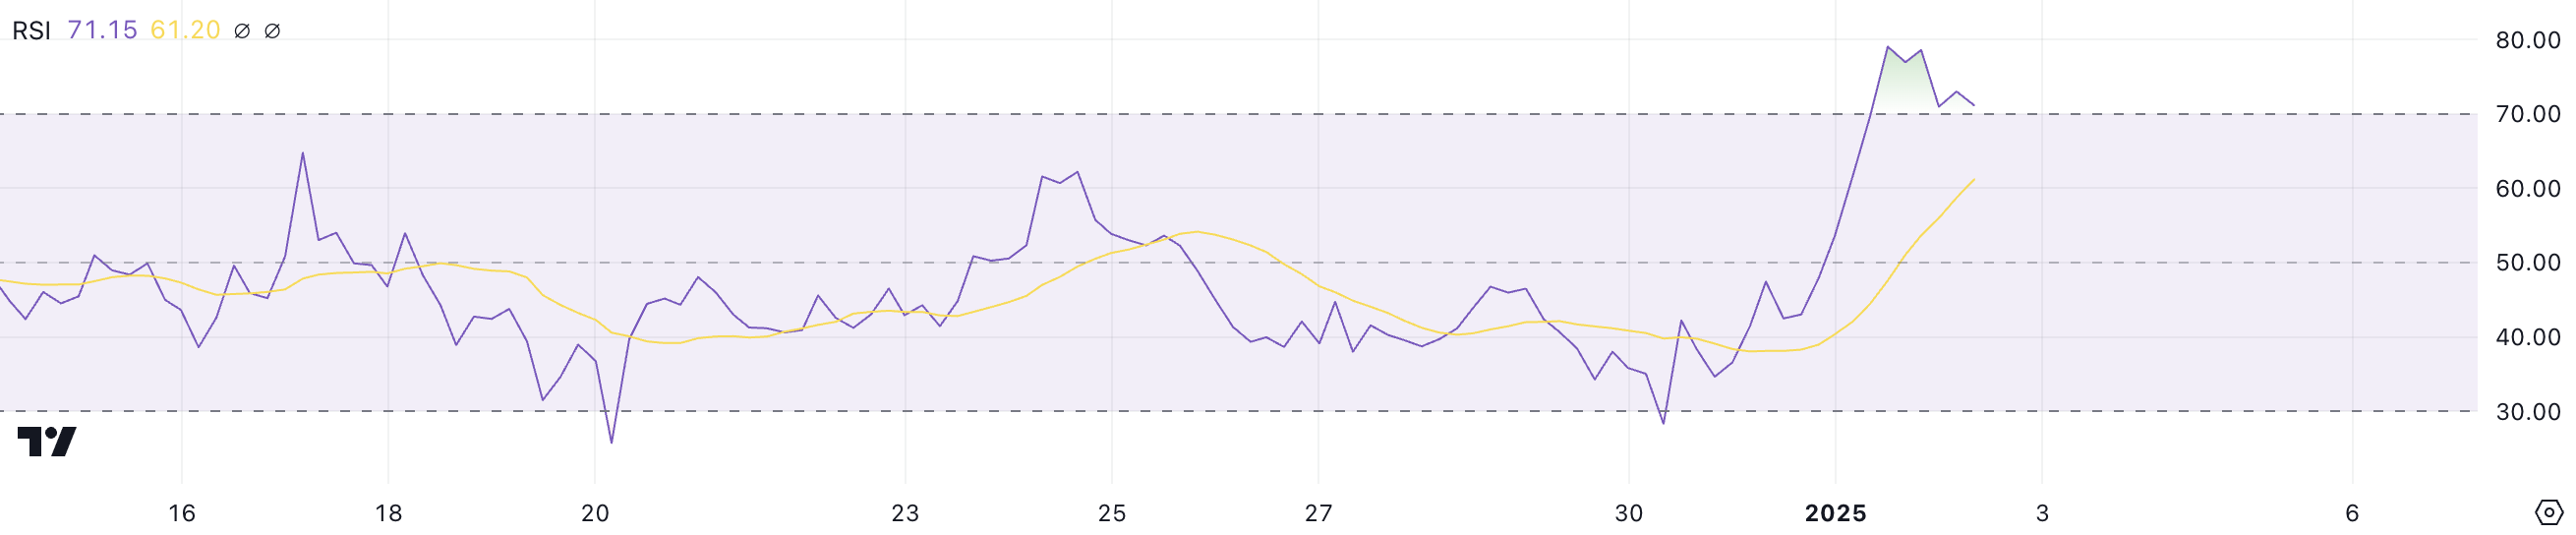
Stellar RSI Is Still In the Overbought Zone
Stellar Relative Strength Index (RSI) is currently at 71.1, remaining above the overbought threshold of 70 since January 1. This marks a significant increase from December 31, when the RSI was in more neutral territory. The elevated RSI reflects strong buying momentum, which has contributed to XLM’s nearly 16% price surge in the past 24 hours.
However, an RSI above 70 also suggests that the asset may be approaching overbought conditions, raising the potential for a near-term pullback or consolidation.
 XLM RSI. Source: TradingView
The RSI is a momentum indicator that measures the speed and strength of price movements on a scale from 0 to 100. Readings above 70 indicate overbought conditions, which often signal that a price correction or consolidation may follow, while readings below 30 suggest oversold conditions and potential recovery.
With XLM RSI at 71.1, the indicator suggests that bullish momentum remains strong but that the asset is entering a zone where upward movement might become harder to sustain.
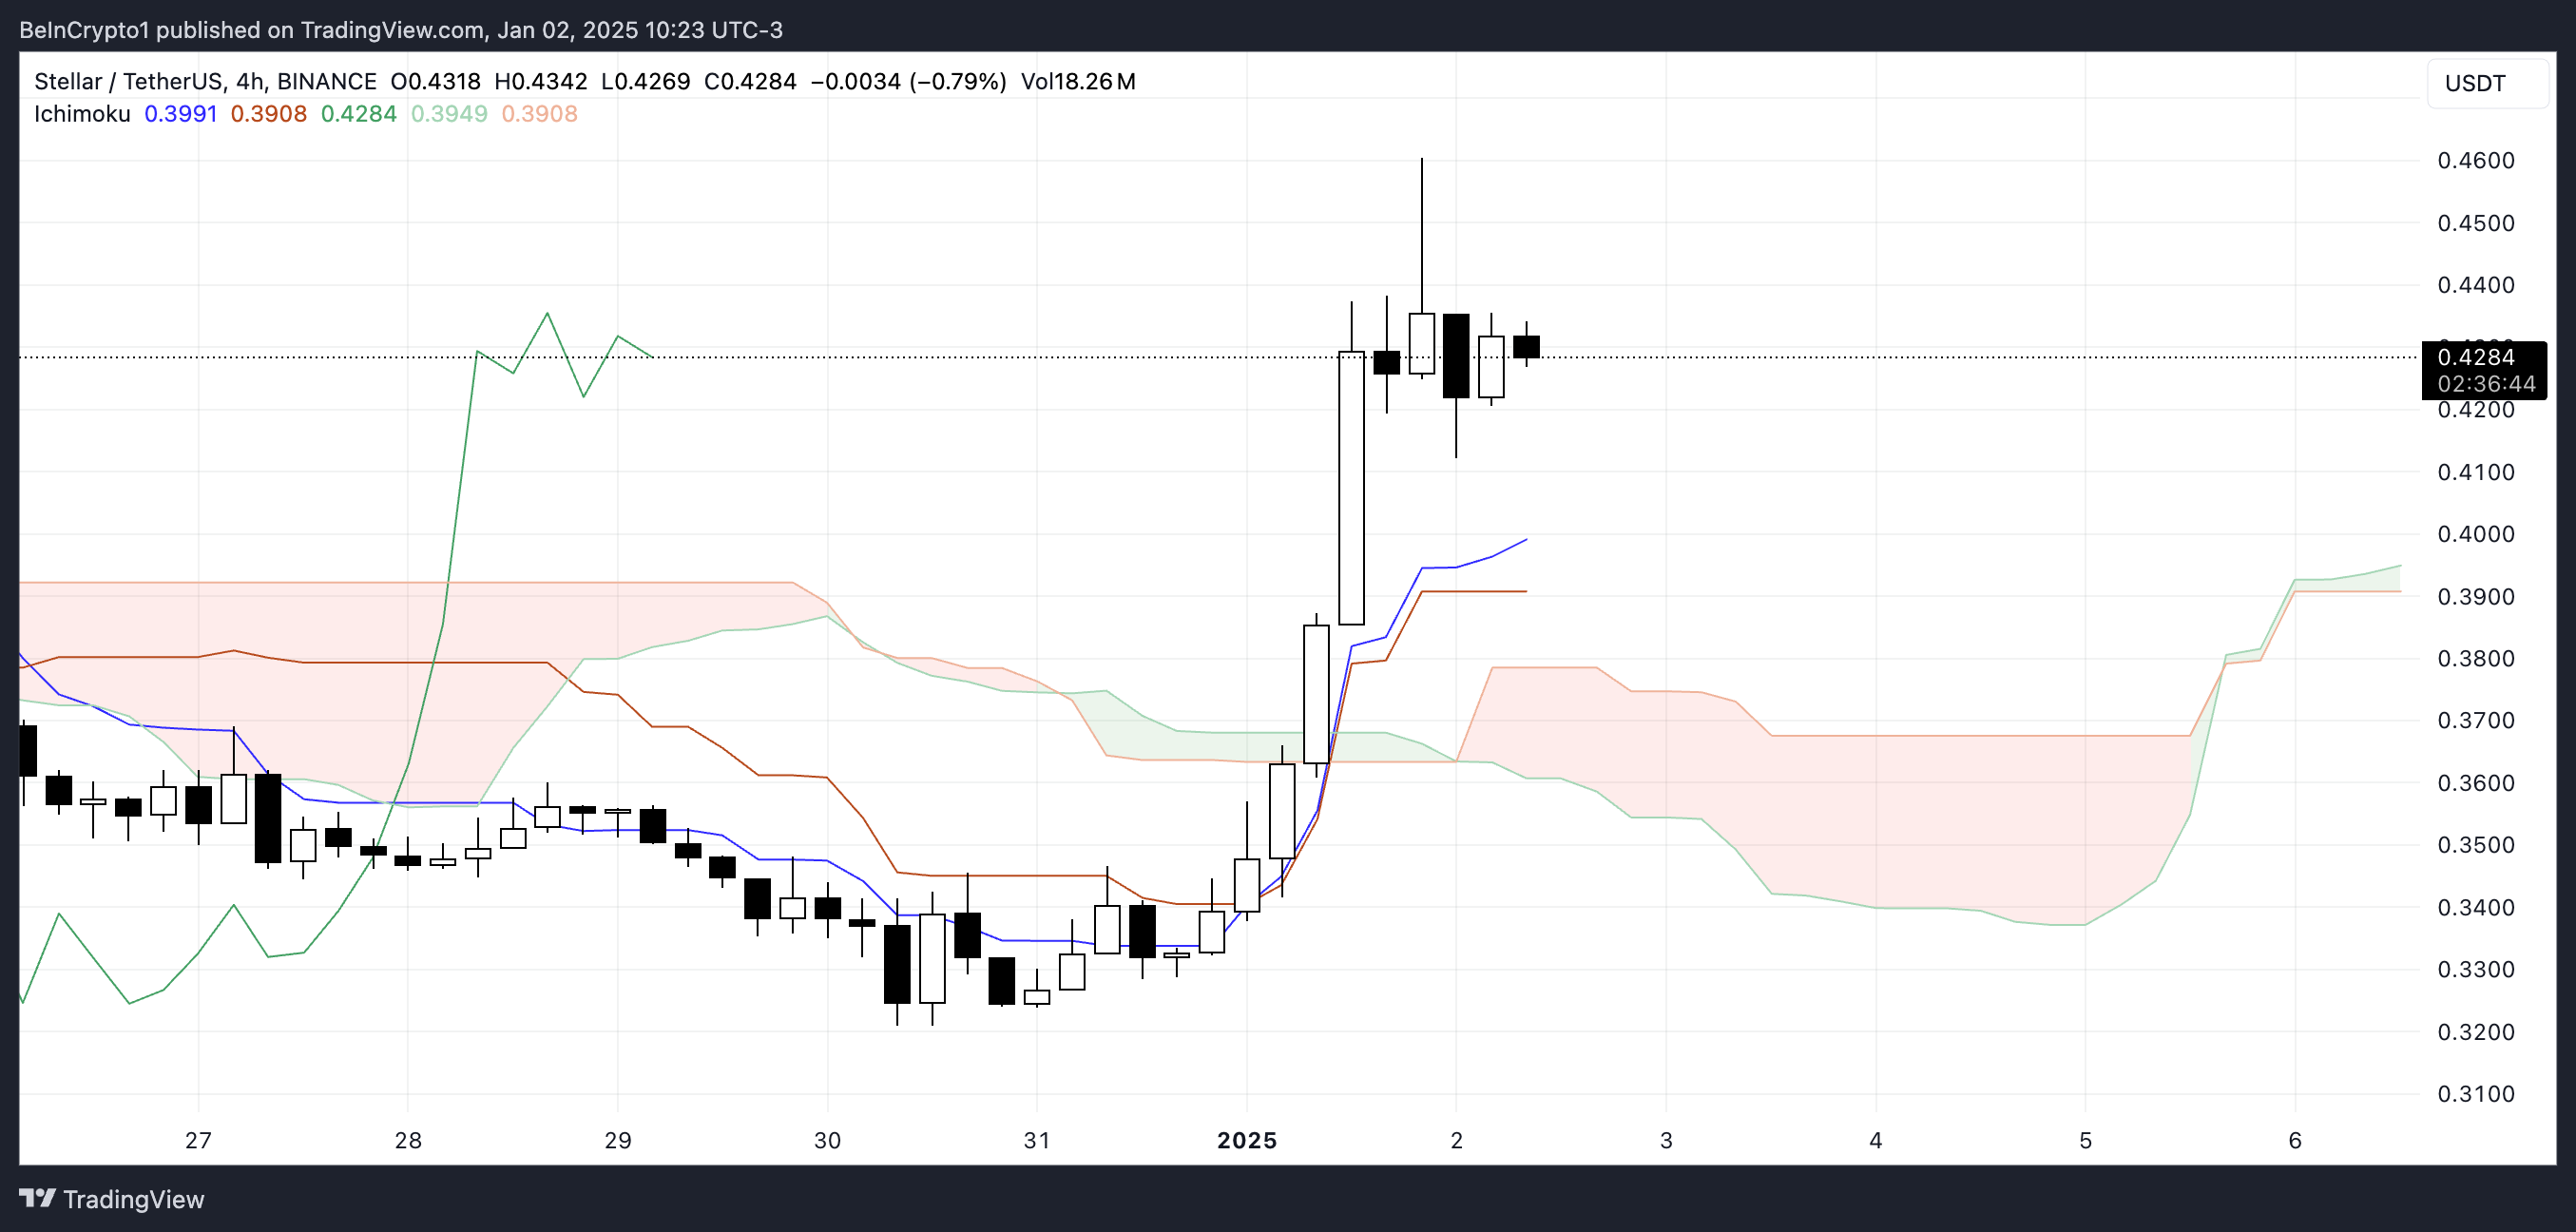
Ichimoku Cloud Shows a Bullish Momentum
The Ichimoku Cloud chart for Stellar reflects a strong bullish setup, with the price positioned well above the red cloud. This upward breakout from the cloud signifies a decisive shift in momentum, with buyers firmly in control.
The green cloud ahead, formed by Senkou Span A and Senkou Span B, further confirms bullish sentiment, suggesting a continuation of the upward trend in the near term.
 XLM Ichimoku Cloud. Source: TradingView
Additionally, the blue Tenkan-sen (conversion line) has crossed above the orange Kijun-sen (baseline), reinforcing the bullish momentum as short-term price action outpaces the longer-term trend. The green Chikou Span (lagging span) is above both the price and the cloud, indicating that the bullish trend is consistent with recent price history.
Overall, the Ichimoku Cloud setup suggests that XLM is in a strong uptrend, with support from technical indicators pointing to further potential gains.
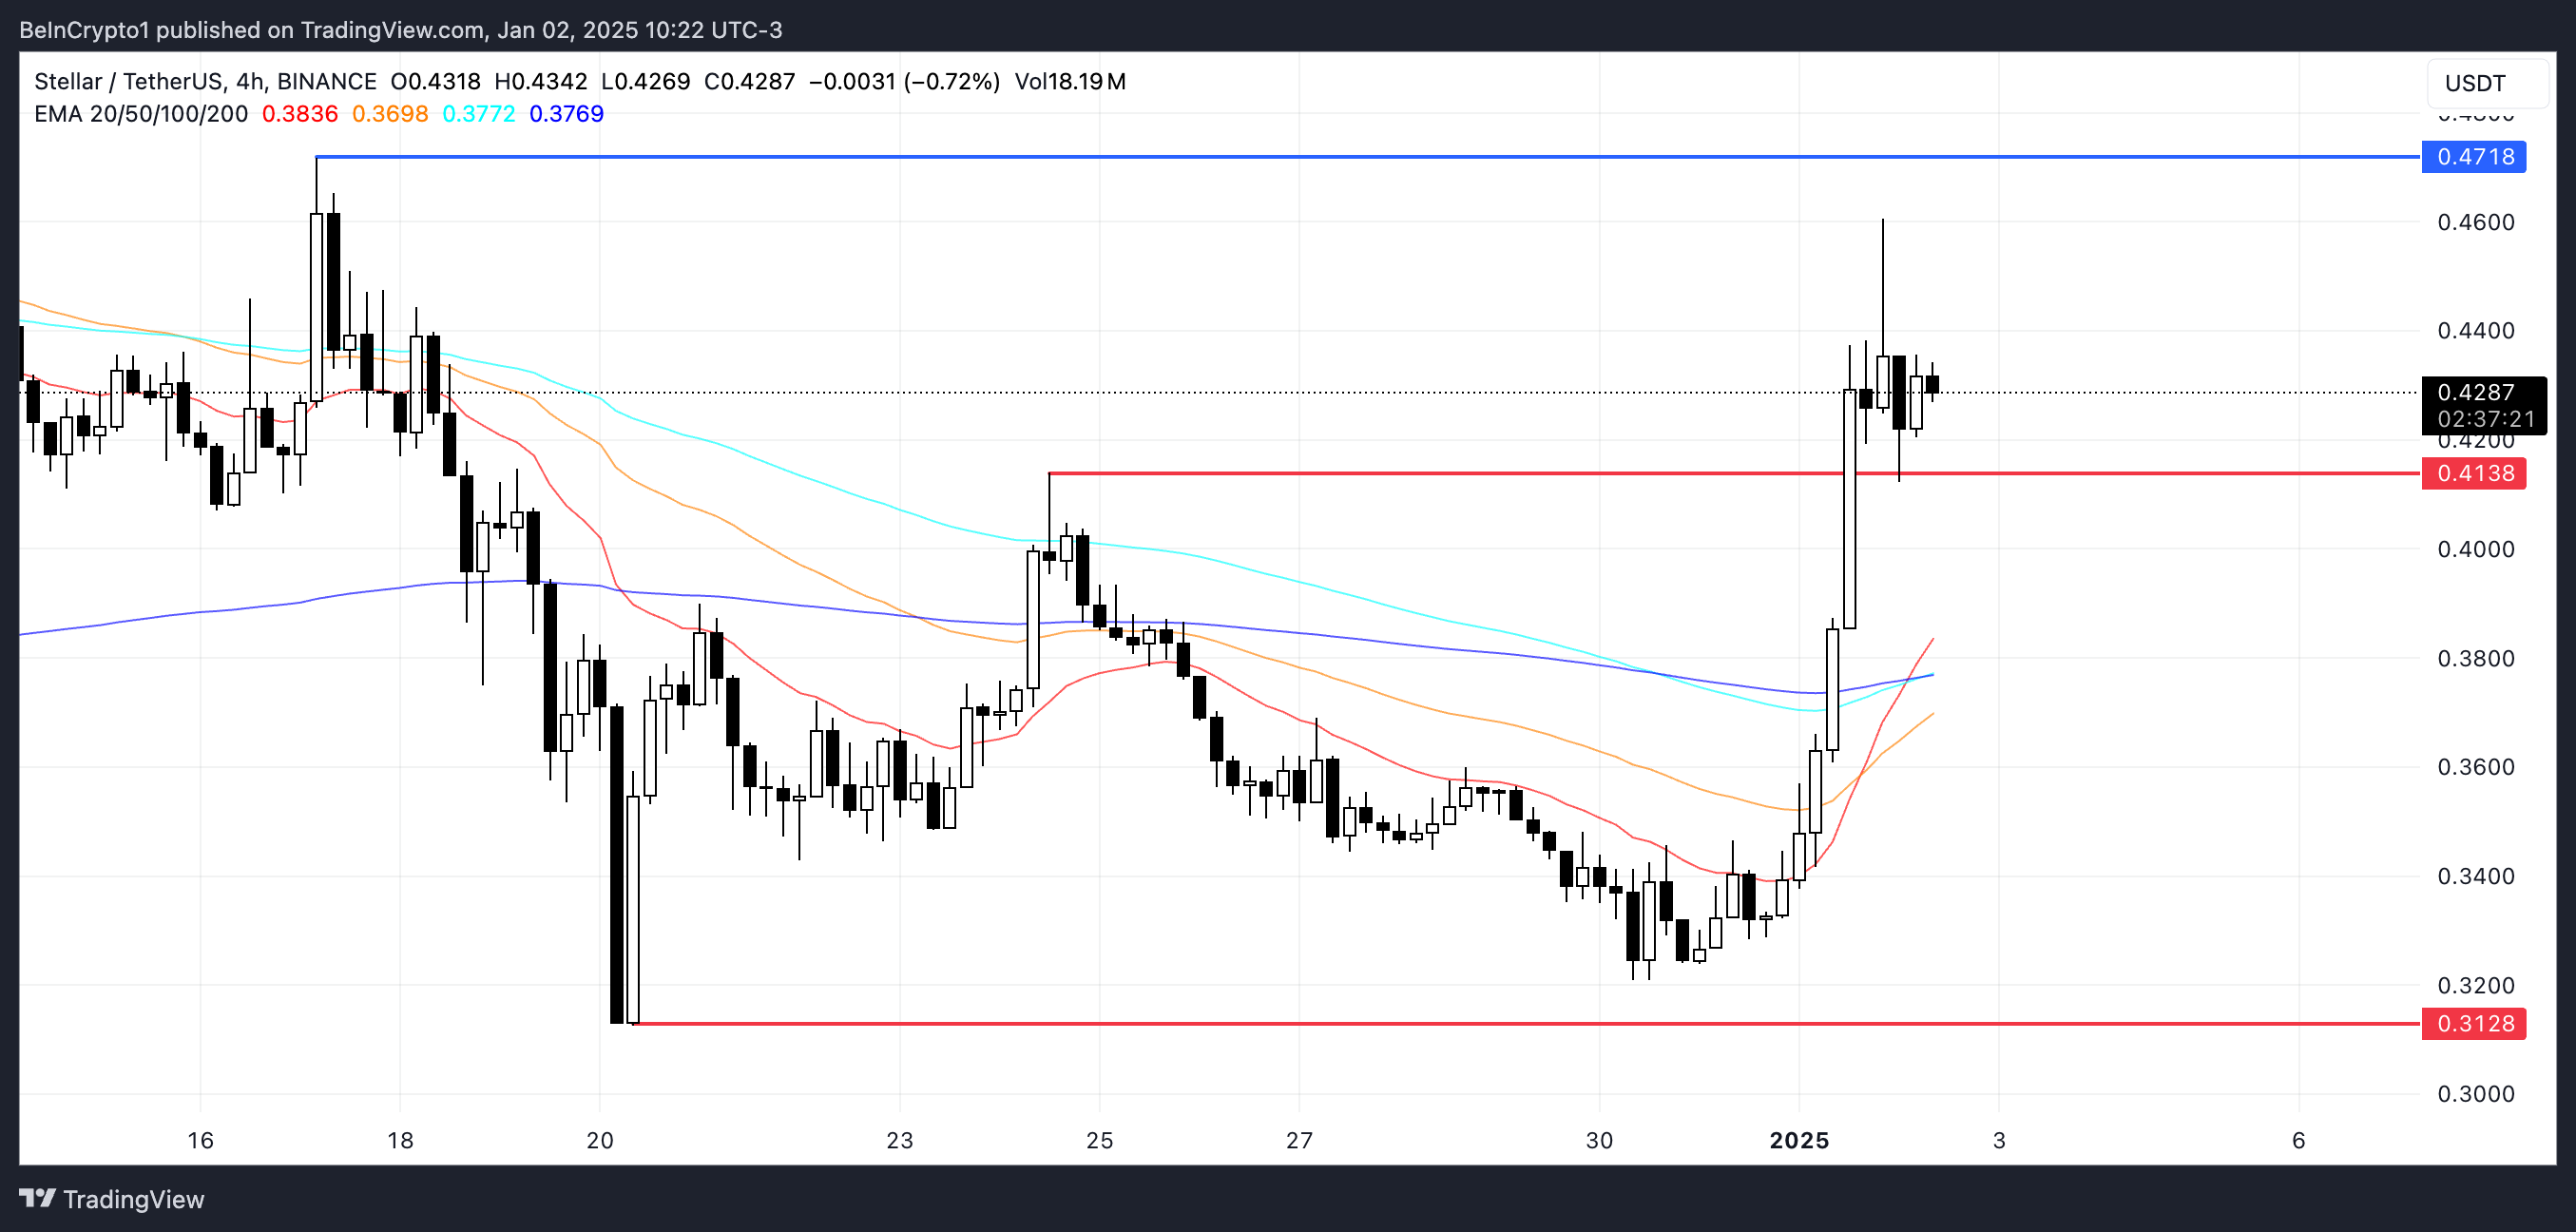
XLM Price Prediction: Potential 27% Correction If the $0.41 Support Fails
Stellar EMA lines recently formed a golden cross, a bullish indicator that occurs when the shorter-term EMA crosses above the longer-term EMA.
This technical signal suggests the potential for sustained upward momentum. If the current uptrend continues, Stellar price could test the $0.47 resistance level. A successful breakout above $0.47 could pave the way for further gains, with the next target at $0.50, signaling growing bullish sentiment.
 XLM Price Analysis. Source: TradingView
However, if the uptrend loses steam, XLM price risks breaking below its nearest support at $0.41. Failure to hold this level could lead to a sharp decline, with the next strong support at $0.31 representing a potential 27% correction.
Read more
* The content presented above, whether from a third party or not, is considered as general advice only. This article should not be construed as containing investment advice, investment recommendations, an offer of or solicitation for any transactions in financial instruments.


