

Bitcoin Price Forecast: BTC consolidates as Trump tariffs go into effect

- Gold Price Trend Forecast: Expectations of Easing US-Iran Tensions Boost Gold Prices, $4,070 Becomes Key Level for Bulls and Bears
- Gold Price Trend Forecast: Why Did Gold Prices Fall After US CPI Cooled? Fed Chair Speech and Iran Situation Become Obstacles
- TradingKey Daily Market Brief: Gold Falls Below $4,000, TSMC’s Strong Earnings Fail to Stop AI Trade Cooling, Chip Stocks Sold Off
- Gold Price Forecast: Cooling Inflation Fails to Offset Fed Hawkish Pressure, Gold Price May Fall to $3,500
- Euro declines to near 1.1400 as US launches fresh strikes on Iran
- Tesla Q2 Earnings Preview: Record Deliveries Fail to Hide Profit Pressure, Can Musk Rely on AI and Autonomous Driving to Unlock New Growth Space?

Bitcoin price has been consolidating below the $116,000 resistance level so far this week, indicating indecisiveness among traders.
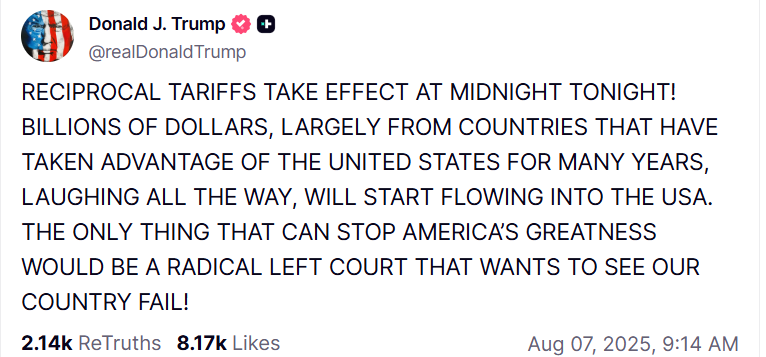
Trump’s sweeping tariffs take effect, while new trade-related announcements could potentially inject fresh volatility.
BTC is trading within a low-liquidity “air gap” between $110,000 and $116,000, a zone that has historically attracted opportunistic accumulation.
Bitcoin (BTC) has been trading sideways below the $116,000 mark so far this week, reflecting a cautious tone among traders amid growing macroeconomic uncertainty. US President Donald Trump’s reciprocal tariffs are already in force, while new trade-related announcements could potentially inject fresh volatility into the crypto markets.
Trump’s constant tariff threats could hit BTC
US President Donald Trump’s reciprocal tariffs went into effect on Thursday. So far this week, Bitcoin prices have been consolidating between the $113,000 and $116,000 ranges, highlighting market participants' indeciveness and awaiting a key catalyst. In this sense, any new trade-related announcements could potentially bring fresh volatility in crypto markets.
According to K33 Research BTC 30-day volatility stays at one-year lows at 1.33% and seven-day volatility hovers at a modest 1.2% after hitting a near two-year low of 0.76% on July 30, the lowest volatility recorded since September 2023.
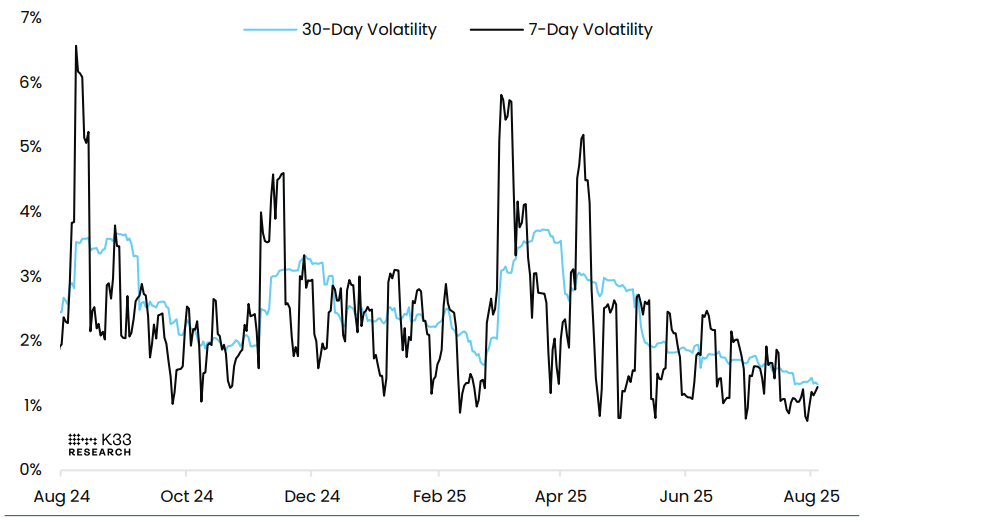
BTC-USD Volatility chart. Source: K33 Research
Despite no directional bias and low volatility, the growing acceptance that the US Federal Reserve (Fed) will resume its rate-cutting cycle in September adds some optimism to riskier assets such as Bitcoin.
According to the CME Group's FedWatch Tool, market participants see a more than 90% chance that the US central bank will lower borrowing costs at the next monetary policy meeting in September. Moreover, the Fed is expected to deliver at least two 25-basis-point rate cuts by the end of this year.
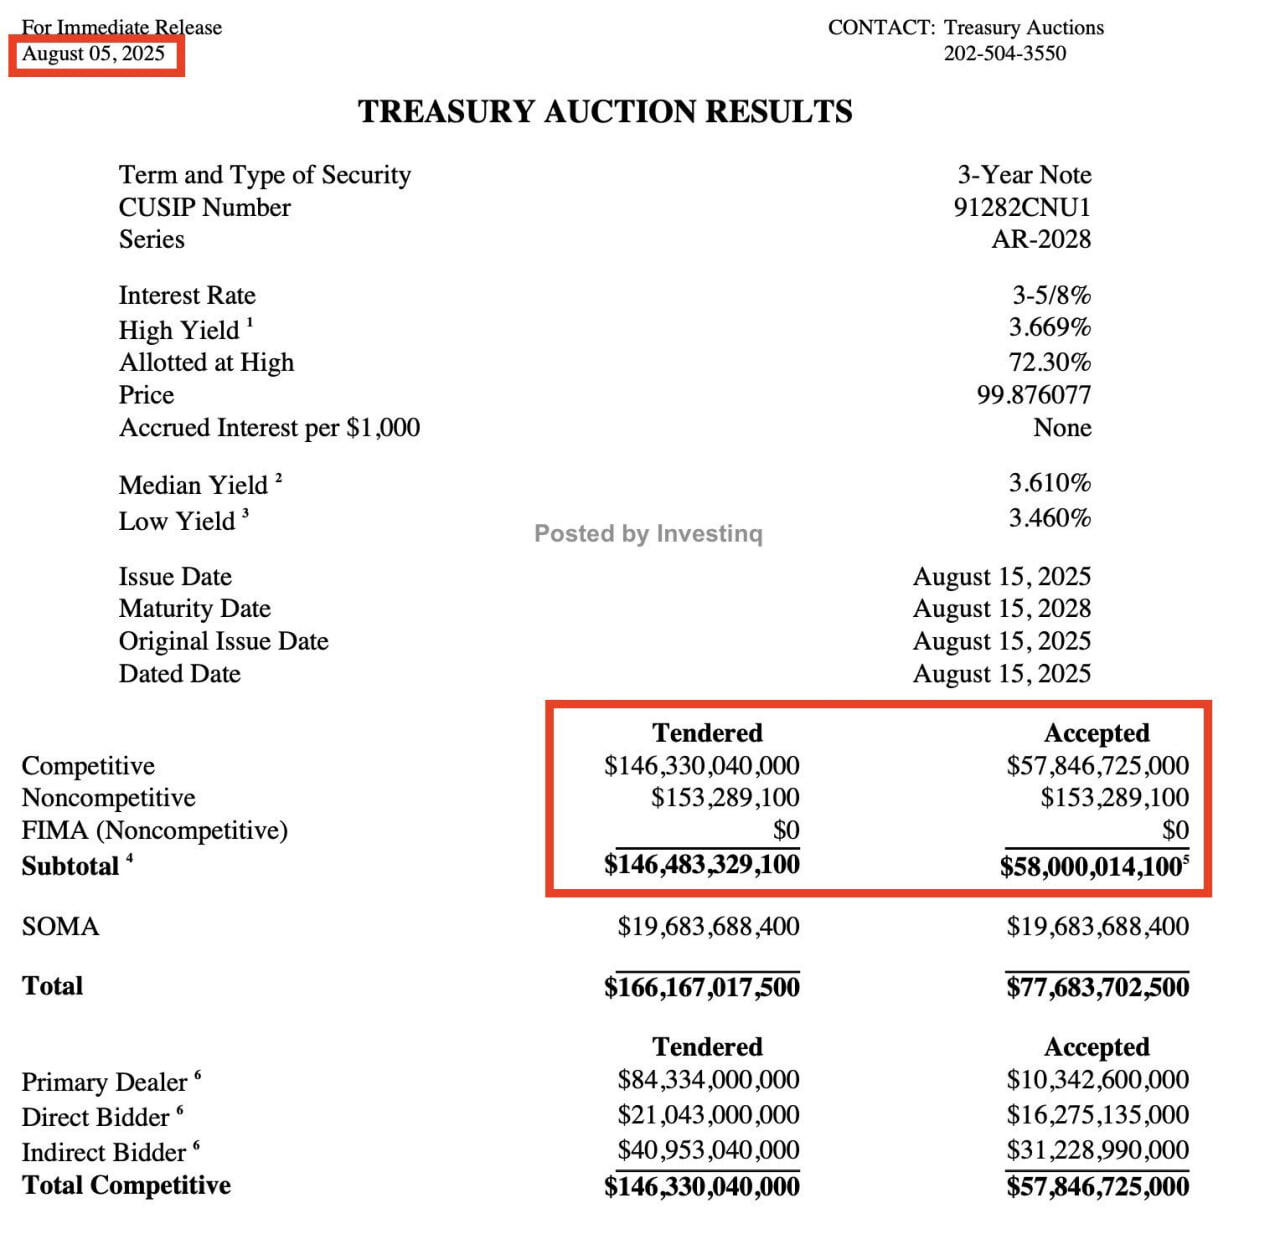
Moreover, a recent $58 billion US debt auction saw foreign demand fall to a one-year low, forcing domestic banks and investors to absorb the excess—an early warning that, if this trend continues, the Federal Reserve may be pressured to resume money printing, which could further support Bitcoin’s appeal as a hedge.
Institutional demand recovers somewhat
Institutional demand shows some signs of relief. According to the SoSoValue data, US spot Bitcoin ETFs recorded a mild inflow of $91.55 million on Wednesday, breaking a four-day streak of outflows. However, the current inflow levels remain lower than those recorded around July 10, which preceded Bitcoin's surge to a new all-time high of $123,218 on July 14.
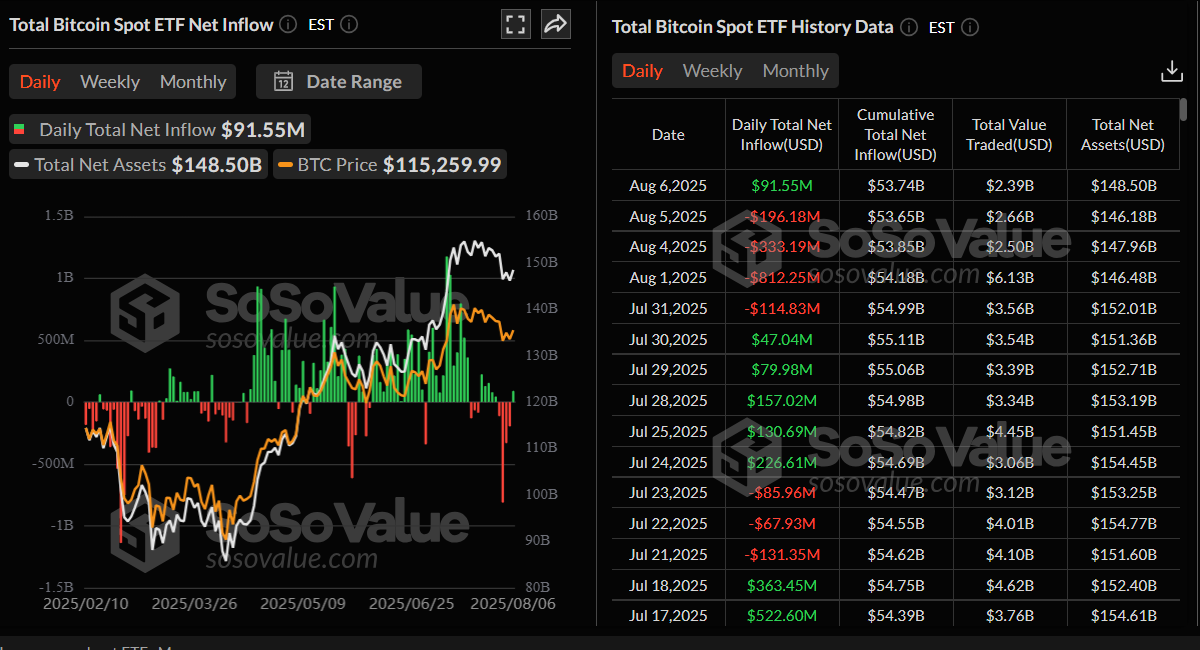
Total Bitcoin spot ETF net inflow daily chart. Source: SoSoValue
BTC’s low-liquidity price ranges highlight new accumulation zones
Glassnode reported on Wednesday that the Bitcoin price has slipped below the $116,000 accumulation range low and entered a low-liquidity “air gap” ranging between $110,000 and $116,000, as shown in the graph below. Historically, such low-liquidity price ranges often evolve into new accumulation zones where opportunistic buyers step in to acquire BTC at a perceived discount to the latest ATH.
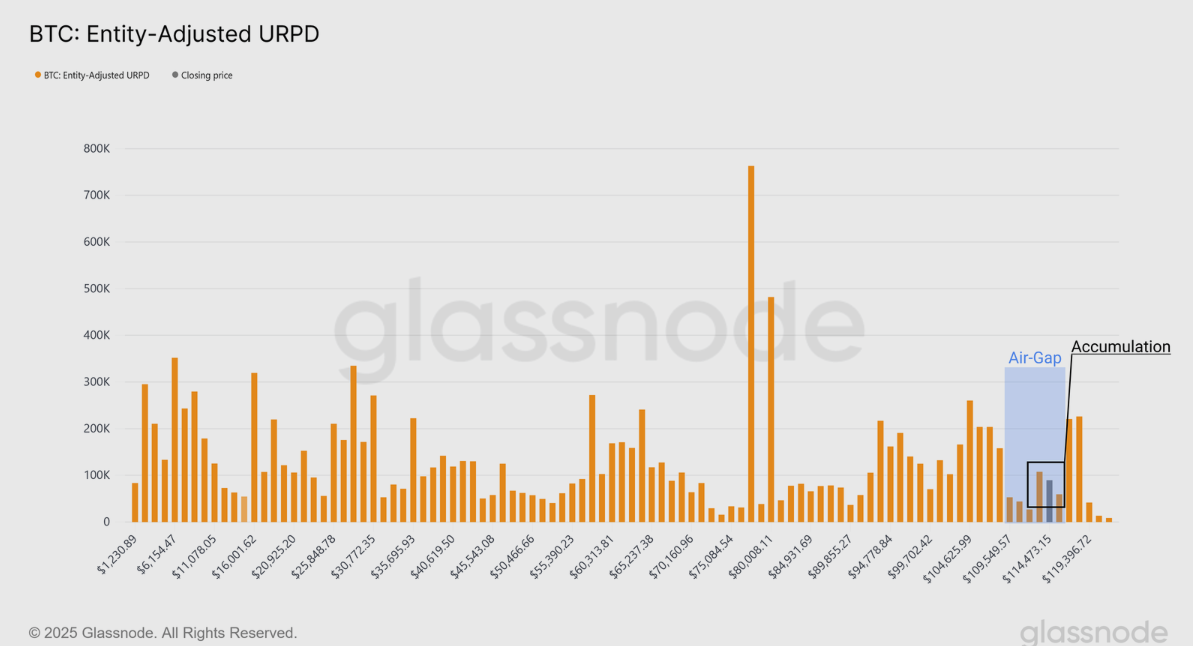
BTC: Entity-Adjusted URPD chart. Source: Glassnode
The report also highlighted that the proportion of Short-Term-Holder (STH) spent coins that are taking profit has cooled off, and trading at 45%, which is below the neutral threshold. Overall, this suggests the market is in a relatively balanced position, with 70% of STH supply still held in profit, and an almost even split of profit and loss taking in coins which are on the move.
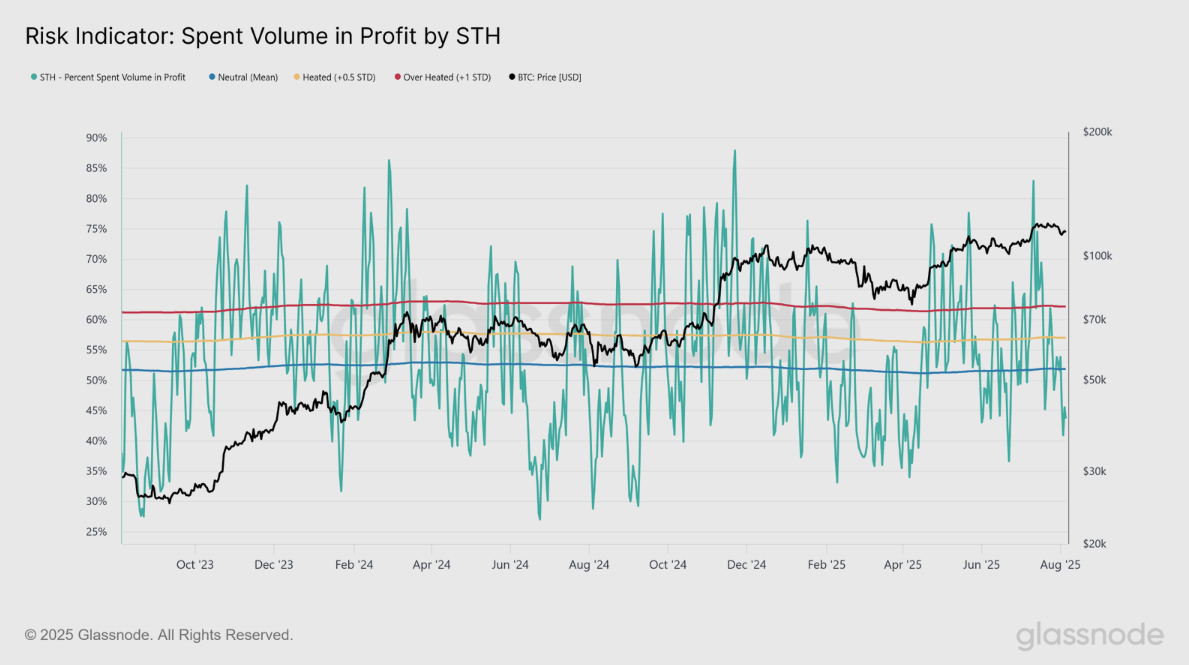
Risk Indicator: Spent Volume in profit by STH chart. Source: Glassnode
Bitcoin Price Forecast: Consolidation persists
Bitcoin price closed below its lower consolidation level at $116,000 at the end of July and declined nearly 3% in the next two days, retesting its 50-day Exponential Moving Average at around $113,182. This 50-day EMA roughly coincides with the previous all-time high of $111,980, making it a key support zone. BTC has recovered slightly and currently hovers around $114,900 as of Thursday.
If BTC closes above $116,000 on a daily basis, it could extend the rally toward its key psychological level at $120,000.
The Relative Strength Index (RSI) on the daily chart is flattening around its neutral level of 50, indicating indecisiveness among traders. However, the Moving Average Convergence Divergence (MACD) continues to tilt bearish after showing a bearish crossover on July 23 that still holds.
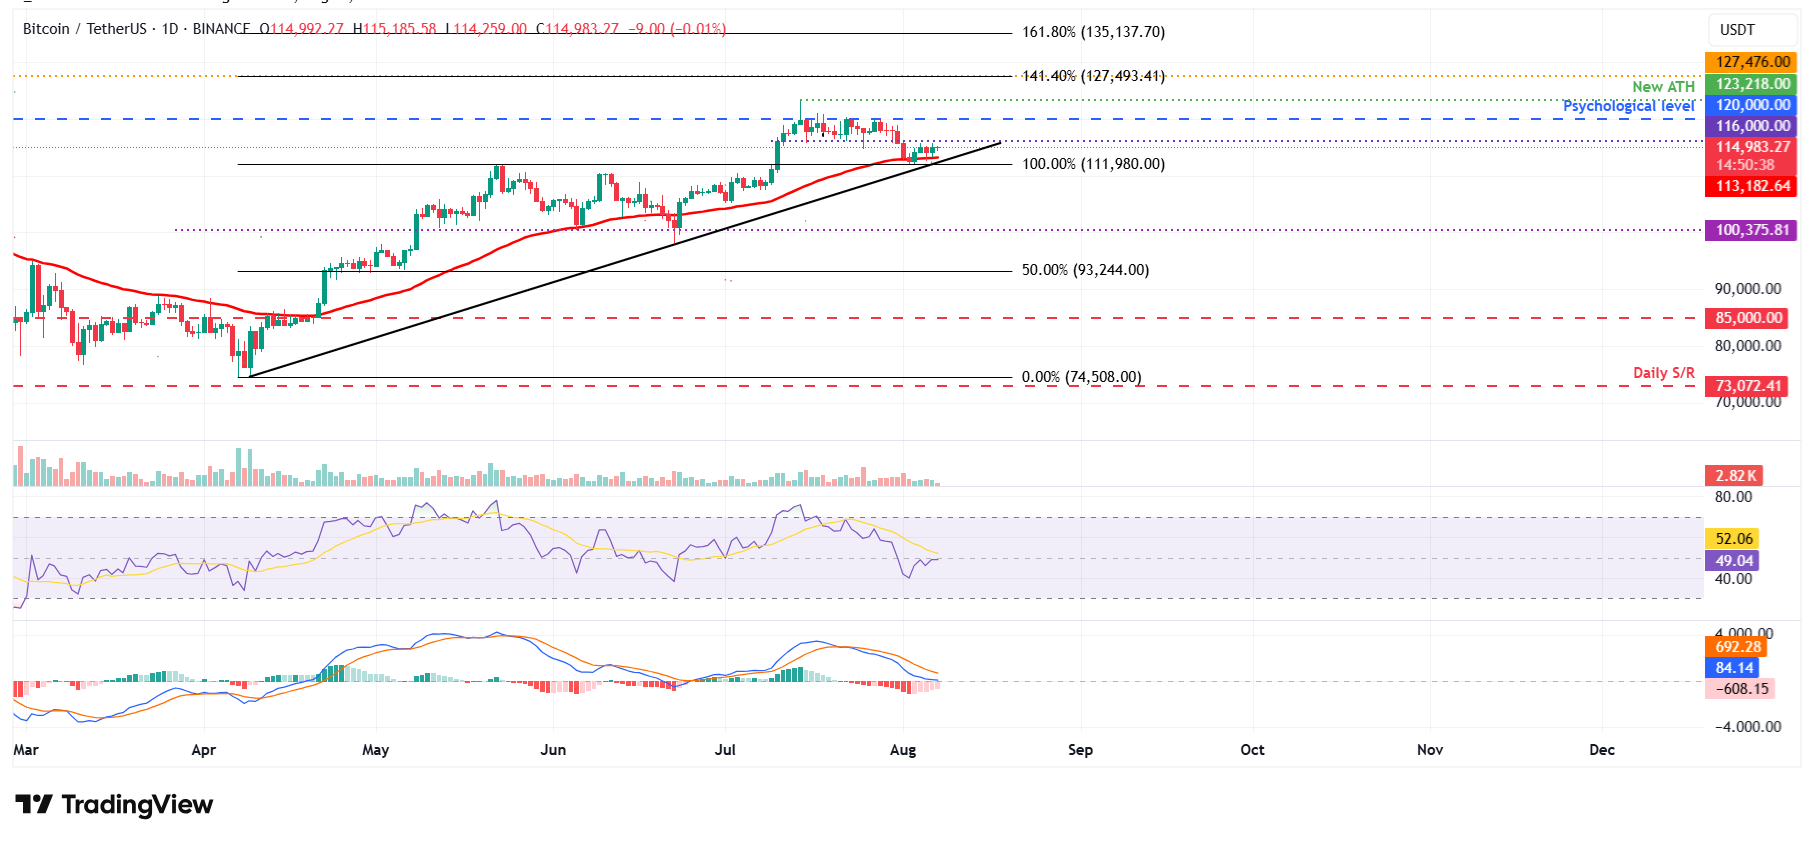
BTC/USDT daily chart
If BTC closes below its 50-day EMA at $113,182, it could extend the decline to retest its previous all-time high of $111,980 from May 22.
Read more
* The content presented above, whether from a third party or not, is considered as general advice only. This article should not be construed as containing investment advice, investment recommendations, an offer of or solicitation for any transactions in financial instruments.


