

Bitcoin Weekly Forecast: BTC looks set for correction amid increasing sell signals


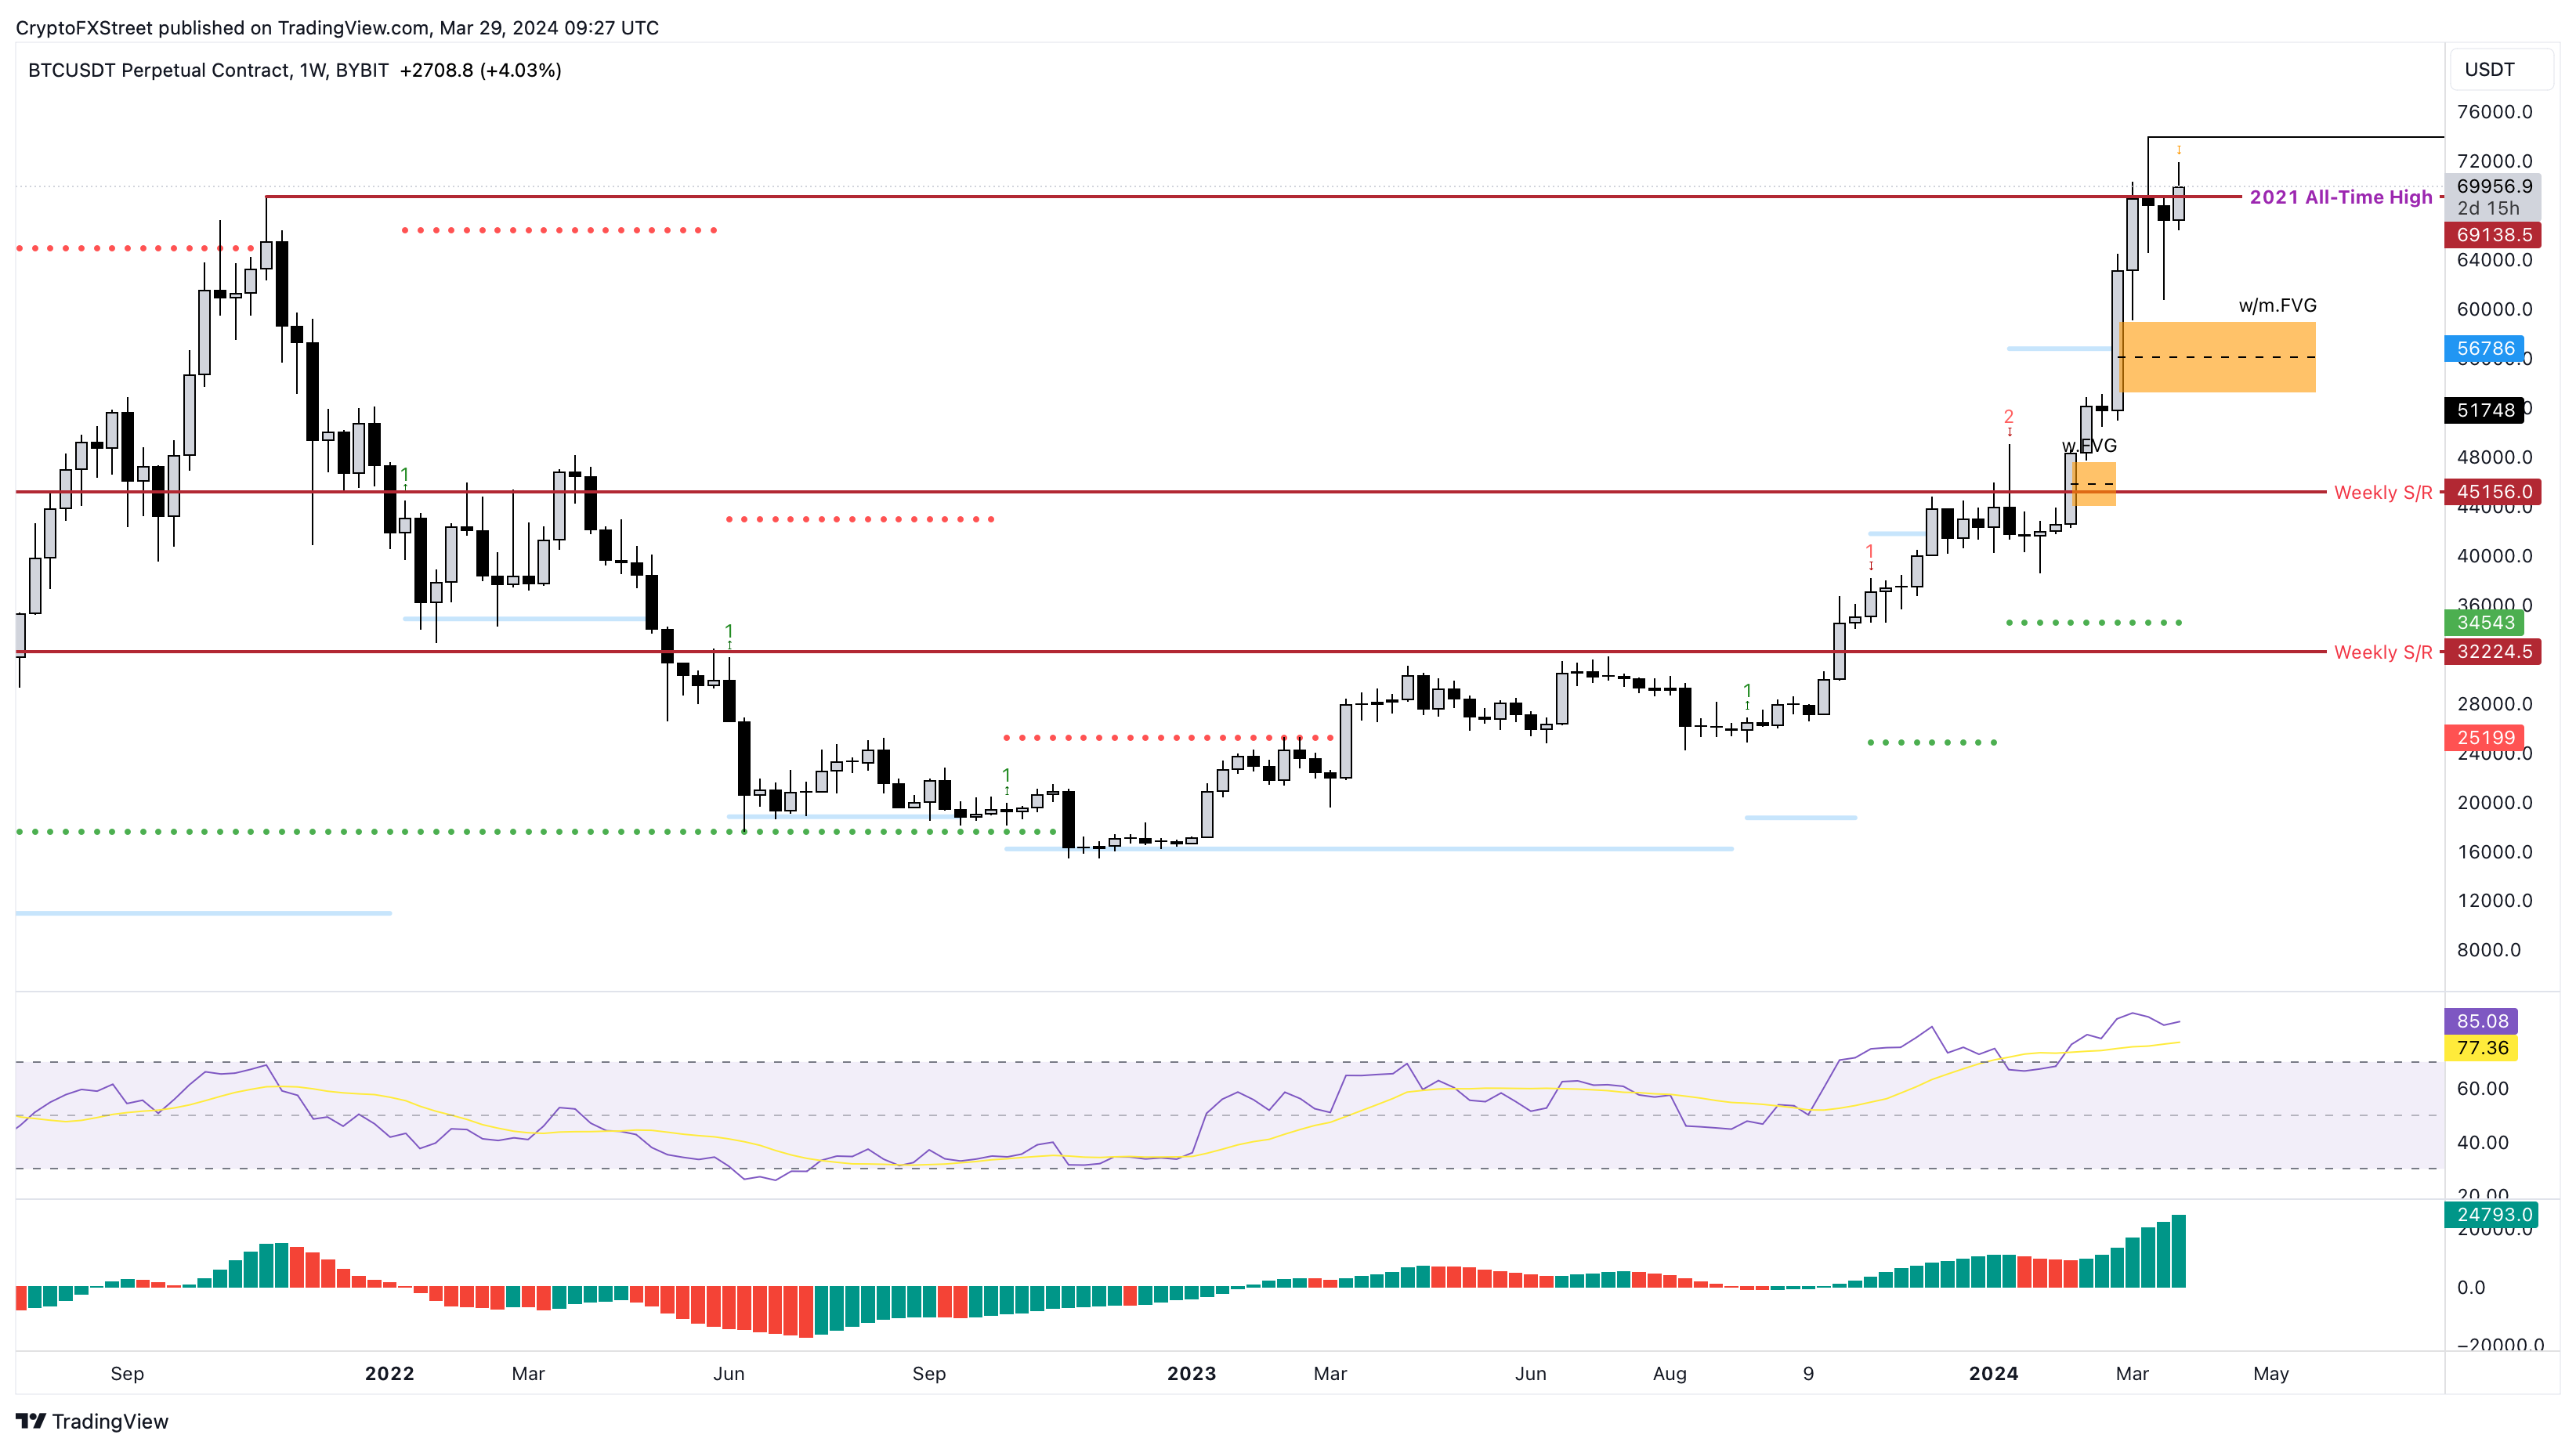
Bitcoin price consolidates below the 2021 all-time high of $69,138.
The risk of a correction to sub-$60,000 remains high as sell signals mount.
A flip of the $75,000 level into a support floor would invalidate the bearish outlook for BTC.
Bitcoin (BTC) price action remains unchanged as it trades below the 2021 ATH for the fourth consecutive week. With Grayscale’s ETF outflows slowing down, investors expect a positive outlook for the crypto markets, but the short-term directional bias, at least from a technical perspective, remains bearish for BTC.
Bitcoin price lacks directional bias
Bitcoin price hovers around the 2021 ATH of $69,138 after a 65% year-to-date returns. The Momentum Reversal Indicator (MRI)’s warning sell signal of a down yellow arrow hovers above the ongoing weekly candlestick. This technical formation suggests that the next up candlestick would flash a red ‘one’ sell signal. This signal, from a theoretical perspective, forecasts a one-to-four down candlesticks.
Therefore, a correction seems all but likely for Bitcoin price considering its current technical outlook. The ideal levels for accumulation include the imbalance, extending from $53,120 to $59,111.
Although it is an unlikely scenario, unusally high selling pressure could trigger an extension of the correction in Bitcoin price to the $45,156 weekly support level.
BTC/USDT 1-week chart
Further reading on a potential Bitcoin price correction:
Comparison of monthly and weekly BTC price action to determine potential buy-the-dip levels.
Bitcoin’s dead cat bounce scenario.
Bitcoin’s potential rally to $75,000 or $80,000.
A strong weekly candlestick close that pushes Bitcoin price to flip $75,000 into a support floor would suggest that the bulls are still in control. This development would invalidate the bearish thesis and kick-start a run-up to the next key psychological level at $80,000.
* The content presented above, whether from a third party or not, is considered as general advice only. This article should not be construed as containing investment advice, investment recommendations, an offer of or solicitation for any transactions in financial instruments.

