Silver Price Forecast: XAG/USD remains sideways near $27.60 as investors reassess Fed rate cut bets

Source Fxstreet
  • Silver price consolidates around $27.60 as traders reprice Fed rate cut hopes.
  • Sticky US inflation will feed expectations for Fed delaying rate cuts.
  • Investors see the Fed keeping interest rates steady next week.

Silver price (XAG/USD) remains stuck in a tight range around $27.60 in Friday’s American session. Traders reassess expectations for the Federal Reserve (Fed) rate cuts as the United States core Personal Consumption Expenditure Price Index (PCE) for March remain higher than the consensus.

The annual underlying inflation data rose by 2.7% from the estimates of 2.6% but decelerated from the prior reading of 2.8%. On a month-on-month basis, price pressures grew in line with expectations and the prior reading of 0.3%. Price pressures remaining higher fuel expectations for Federal Reserve (Fed) maintaining a hawkish monetary policy framework.

The scenario is favorable for the US Dollar and bond yields but weighs on non-yielding assets, such as Silver. The US Dollar Index (DXY) rebounds from 105.40 amid expectations that the Fed will keep interest rates higher for a longer period. The Fed sees rate cuts appropriate only when they get evidence that inflation will return to the desired rate of 2%. 10-year US Treasury yields are down 1.15% to 4.65%.

Meanwhile, investors shift focus to the Fed’s interest rate decision, which will be announced on May 1. The Fed is anticipated to keep interest rates unchanged in the range of 5.25%-5.50%. Though the Fed is expected to maintain the status quo, investors will focus on guidance on interest rates.

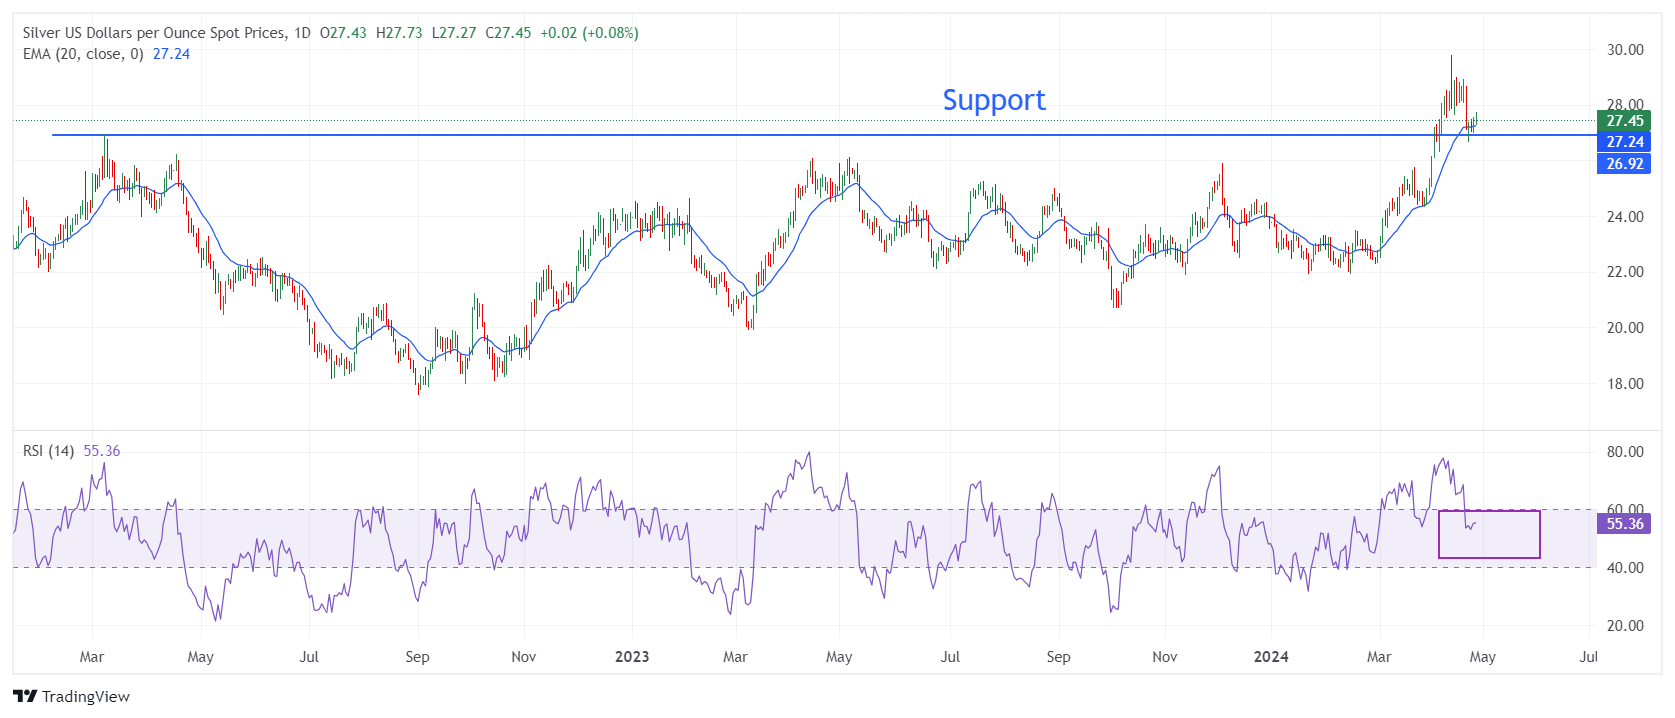
Silver technical analysis

Silver price corrects to near March 2022 high near $27.00 after failing to extend upside above the crucial resistance of $30.00. The near-term appeal for Silver seems uncertain as it struggles to sustain near the 20-day Exponential Moving Average (EMA), which trades around $27.20.

The 14-period Relative Strength Index (RSI) shifts into the 40.00-60.00 range from the bullish range of 60.00-80.00, suggesting that the bullish momentum has faded for now.

Silver daily chart

XAG/USD

Overview
Today last price 27.44
Today Daily Change 0.01
Today Daily Change % 0.04
Today daily open 27.43
 
Trends
Daily SMA20 27.46
Daily SMA50 25.33
Daily SMA100 24.24
Daily SMA200 23.76
 
Levels
Previous Daily High 27.58
Previous Daily Low 26.98
Previous Weekly High 29.02
Previous Weekly Low 27.62
Previous Monthly High 25.77
Previous Monthly Low 22.51
Daily Fibonacci 38.2% 27.35
Daily Fibonacci 61.8% 27.21
Daily Pivot Point S1 27.08
Daily Pivot Point S2 26.74
Daily Pivot Point S3 26.49
Daily Pivot Point R1 27.67
Daily Pivot Point R2 27.92
Daily Pivot Point R3 28.27


Disclaimer: For information purposes only. Past performance is not indicative of future results.
placeholder
AI Boom Lifts US Stocks, Strategist Sees S&P Breaking 10,000 in Three Years, How Much Longer Can This Rally Last? U.S. stocks closed at record highs again on Monday; despite growing concerns that a prolonged conflict in Iran through the summer could trigger severe economic consequences, the rally rem
Author  TradingKey
6 hours ago
U.S. stocks closed at record highs again on Monday; despite growing concerns that a prolonged conflict in Iran through the summer could trigger severe economic consequences, the rally rem
placeholder
Gold drifts higher to near $4,750 ahead of US CPI inflation releaseGold price (XAU/USD) trades in positive territory around $4,750 during the early Asian session on Tuesday. The precious metal edges higher as traders assess developments in the United States (US)-Iran diplomacy and await key US inflation data, which is due later on Tuesday. 
Author  FXStreet
15 hours ago
Gold price (XAU/USD) trades in positive territory around $4,750 during the early Asian session on Tuesday. The precious metal edges higher as traders assess developments in the United States (US)-Iran diplomacy and await key US inflation data, which is due later on Tuesday. 
placeholder
When Will the Gold Dilemma Be Resolved? Breakdown of US-Iran Negotiations Puts Gold Prices Under Pressure Again, Can It Return to $5,000? Spot gold broke below the $4,700 level during the Asian trading session on May 11, dropping as low as $4,678. As of press time, it was trading at $4,670, in stark contrast to three days a
Author  TradingKey
Yesterday 10: 31
Spot gold broke below the $4,700 level during the Asian trading session on May 11, dropping as low as $4,678. As of press time, it was trading at $4,670, in stark contrast to three days a
placeholder
Hormuz Latest. Trump Rejects Iran Peace Plan; WTI Crude Hits $100 Again International oil prices surged in early Asian trading after U.S. President Trump and Iran rejected each other's latest long-term peace proposals. Both major crude oil futures rose by mor
Author  TradingKey
Yesterday 02: 45
International oil prices surged in early Asian trading after U.S. President Trump and Iran rejected each other's latest long-term peace proposals. Both major crude oil futures rose by mor
placeholder
Gold slumps below $4,700 on Trump rejection of Iran peace proposalGold price (XAU/USD) falls to around $4,690 during the early Asian session on Monday. The precious metal attracts some sellers after US President Donald Trump rejected Iran’s latest peace offer to end the 10-week conflict choking the Strait of Hormuz, fanning inflation fears. 
Author  FXStreet
Yesterday 01: 55
Gold price (XAU/USD) falls to around $4,690 during the early Asian session on Monday. The precious metal attracts some sellers after US President Donald Trump rejected Iran’s latest peace offer to end the 10-week conflict choking the Strait of Hormuz, fanning inflation fears. 
Related Instrument
goTop
quote