

Bitcoin’s Bounce Might Not Be Bullish Yet; $117,000 is the Line It Must Cross First

- US-Iran Agreement Brought Forward: Pakistani Prime Minister Confirms US-Iran Agreement Has Taken Effect Immediately, Strait of Hormuz Will Reopen Immediately
- WTI hovers around $80.00 as traders await developments on US-Iran peace talks
- Bitcoin network activity hits new high despite stalled prices — CryptoQuant
- WTI Price Forecast: Trades above $75.50 on Iran uncertainty; 200-day SMA holds the key
- Gold Price Forecast: Hawkish Fed Triggers Gold Plunge, Can US-Iran Agreement Push Gold Past $4,360?
- Has Gold Hit Bottom? Barclays, Citi Both Bullish on Gold, Gold Price Will Return to $5,000 Next Year.
The Bitcoin price is showing some signs of life, up 1.1% on the day and trading around $114,000. But zoom out, and the weekly performance still shows a -3.77% decline, leaving traders wondering: is this just a bounce, or the start of the next BTC rally?
To figure that out, it helps to look beyond the chart. On-chain signals from long-term holders, valuation trends, and trader sentiment are starting to line up, and they all point toward one key BTC price level.
Old Holders Step Aside as Selling Pressure Eases
Most meaningful corrections begin when the holders start selling. And that’s exactly why we’re looking at spent output bands right now.
Between July 23 and August 1, the 7–10 year spent output bands widened a bit. This means long-dormant wallets, holding Bitcoin for nearly a decade, were moving coins. This kind of selling pressure was previously encountered between July 10 and July 19, when the Bitcoin prices corrected from the peak of $123,000 to $117,000.
Yet, the long-term holder-induced selling pressure has been declining consistently since the peak made on July 4.
Note: The July 10- July 19 band was wider than the July 23- August 1 band, showing a clear decline in the long-term holders’ selling intent.
And during the current band widening (July 23- August 1), Bitcoin held above $113,000, which shows the market was absorbing that supply without breaking down. And that is a sign of BTC price strength.
 Bitcoin price and Spent Output Bands: Cryptoquant
That selling pressure seems to be fading. The same spent output bands are now thinning out, indicating that the large moves from old holders have likely cooled off. When these wallets stop selling, it often signals the possible end of a correction phase.
Spent Output Bands show when coins of different ages are moved. Wider, fatter bands equate to more movement. When the old ones thin out, it means the supply pressure is fading.
For token TA and market updates: Want more token insights like this? Sign up for Editor Harsh Notariya’s Daily Crypto Newsletter here.
MVRV Ratio Signals Undervaluation, And That’s Historically Bullish
With the supply side settling, the next question is valuation. And for that, the MVRV (Market Value to Realized Value) ratio is flashing a familiar pattern.
Currently, the MVRV stands at 2.19. That’s the same zone that has triggered multiple rallies in recent months.
In June 2025, when it hit 2.16, the Bitcoin price jumped from $101,000 to $110,000 in six days. Back in April, 2.12 led to a move from $101,000 to $119,000. And in November 2024, 2.04 set off a rally from $67,000 to $98,000.
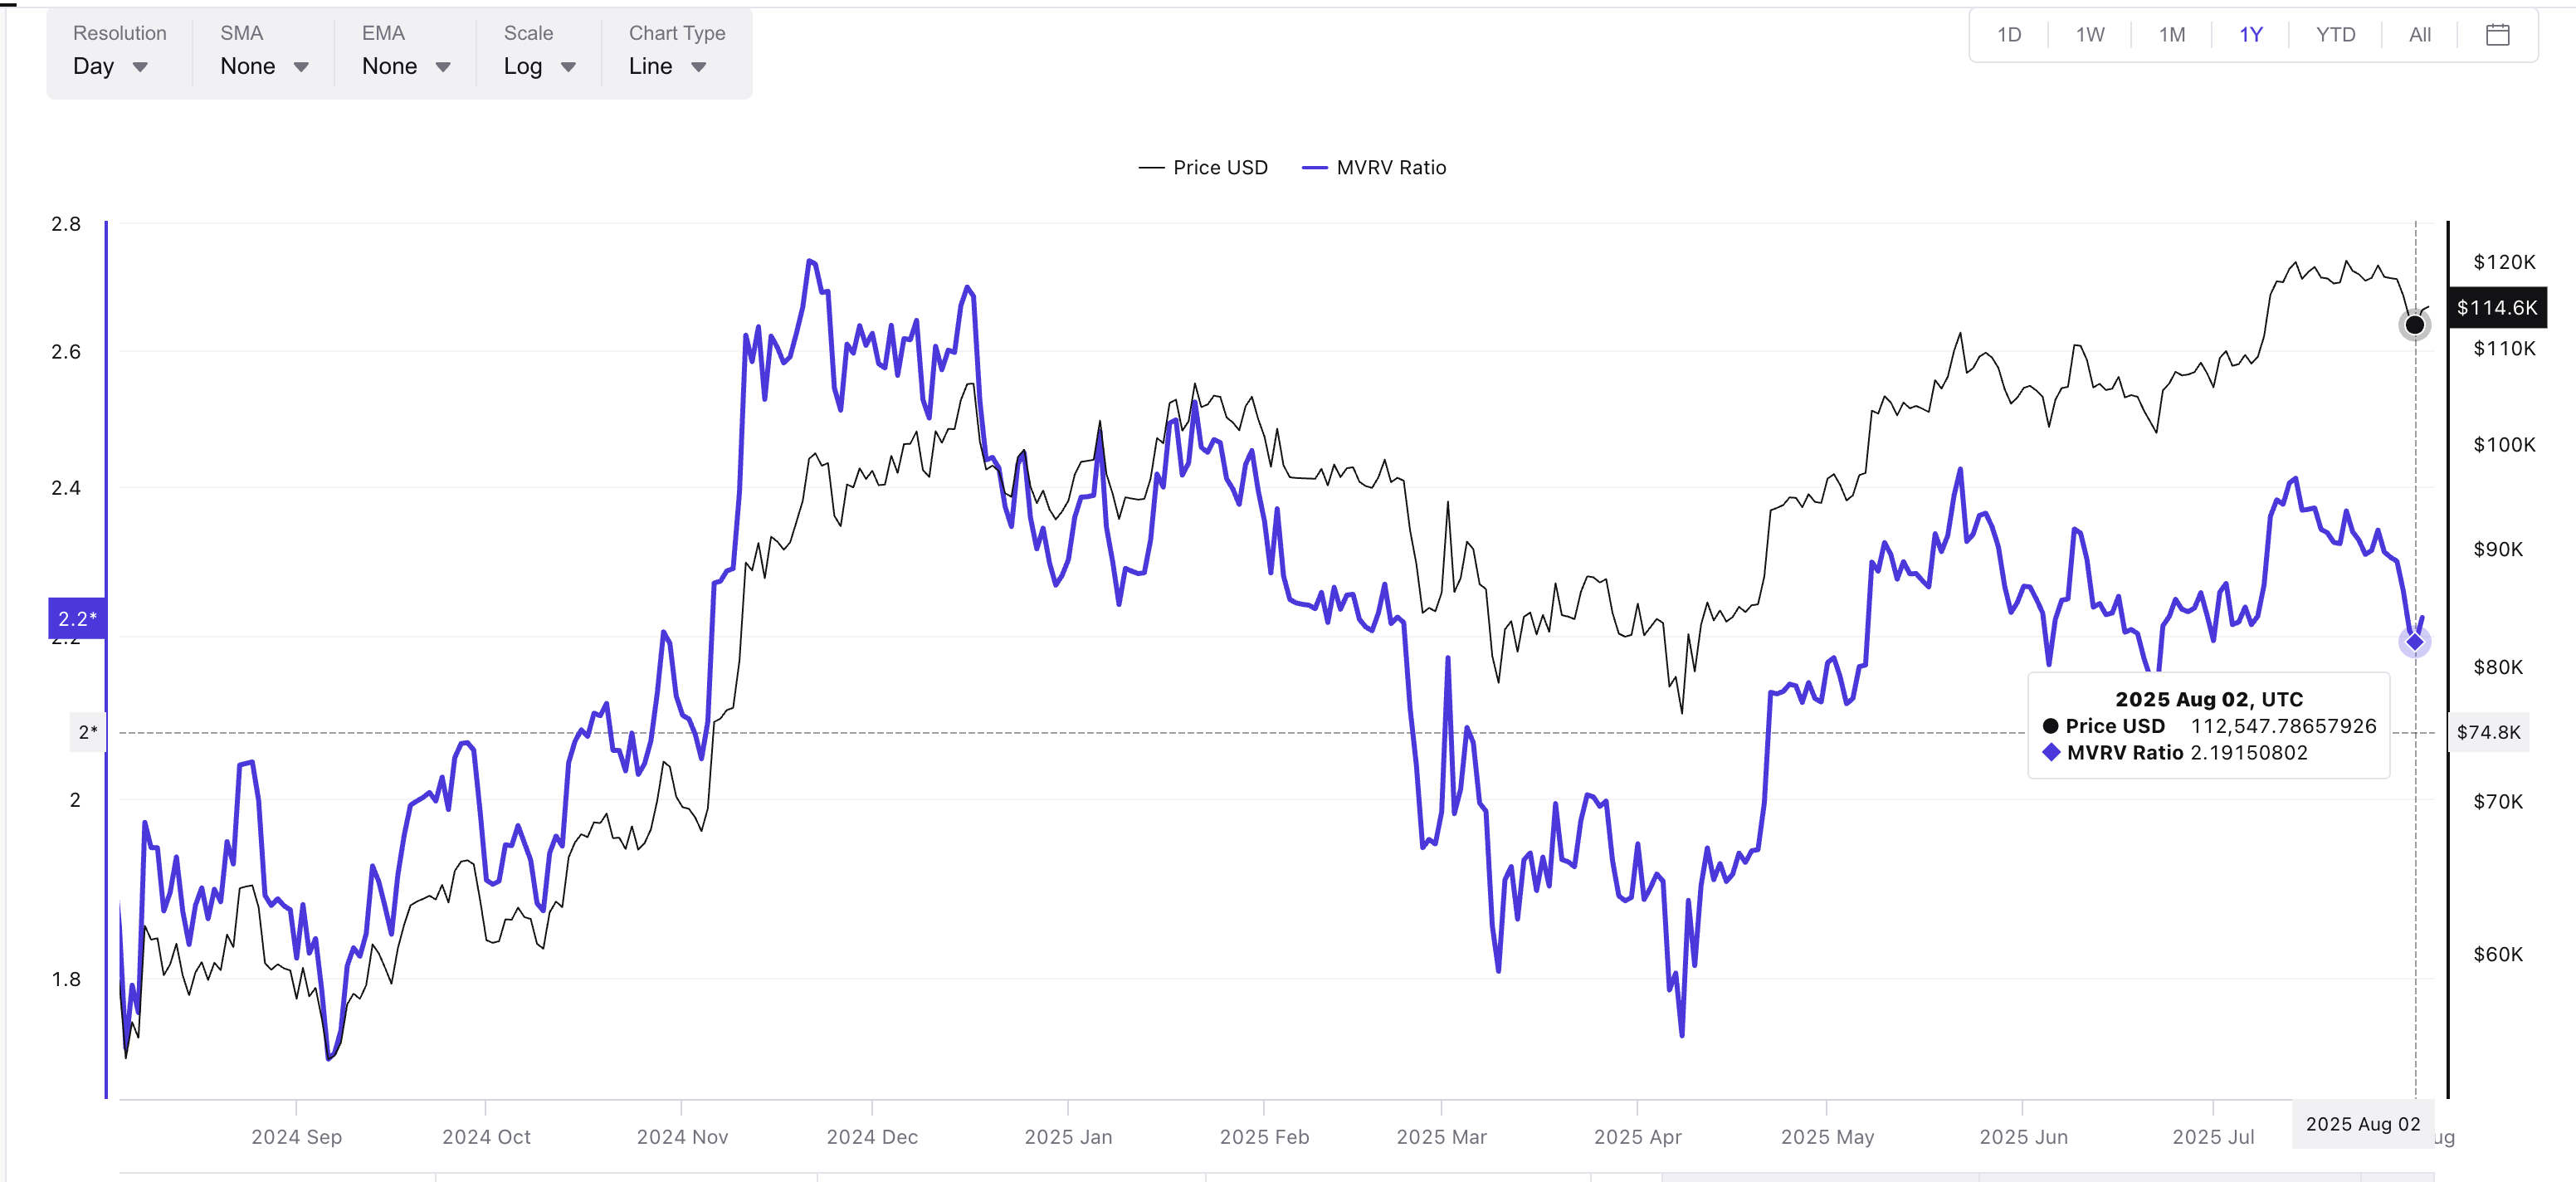 Bitcoin price and MVRV ratio: Cryptoquant
All of those runs had one thing in common: they started when the MVRV hovered just above 2, and supply from older holders had already been flushed out. That’s exactly the setup we’re seeing now.
MVRV compares the current BTC price to the average cost basis of all holders. A low ratio means there’s still room to grow; a high one often means overheated. Right now, we’re in the sweet spot.
Even trader positioning is shifting in the same direction. The long/short ratio, which was down at 0.89 just two days ago, has now flipped to 1.02. It’s a subtle shift, but it confirms that more traders are positioning for upside, just as the valuation signals say there’s room to run.
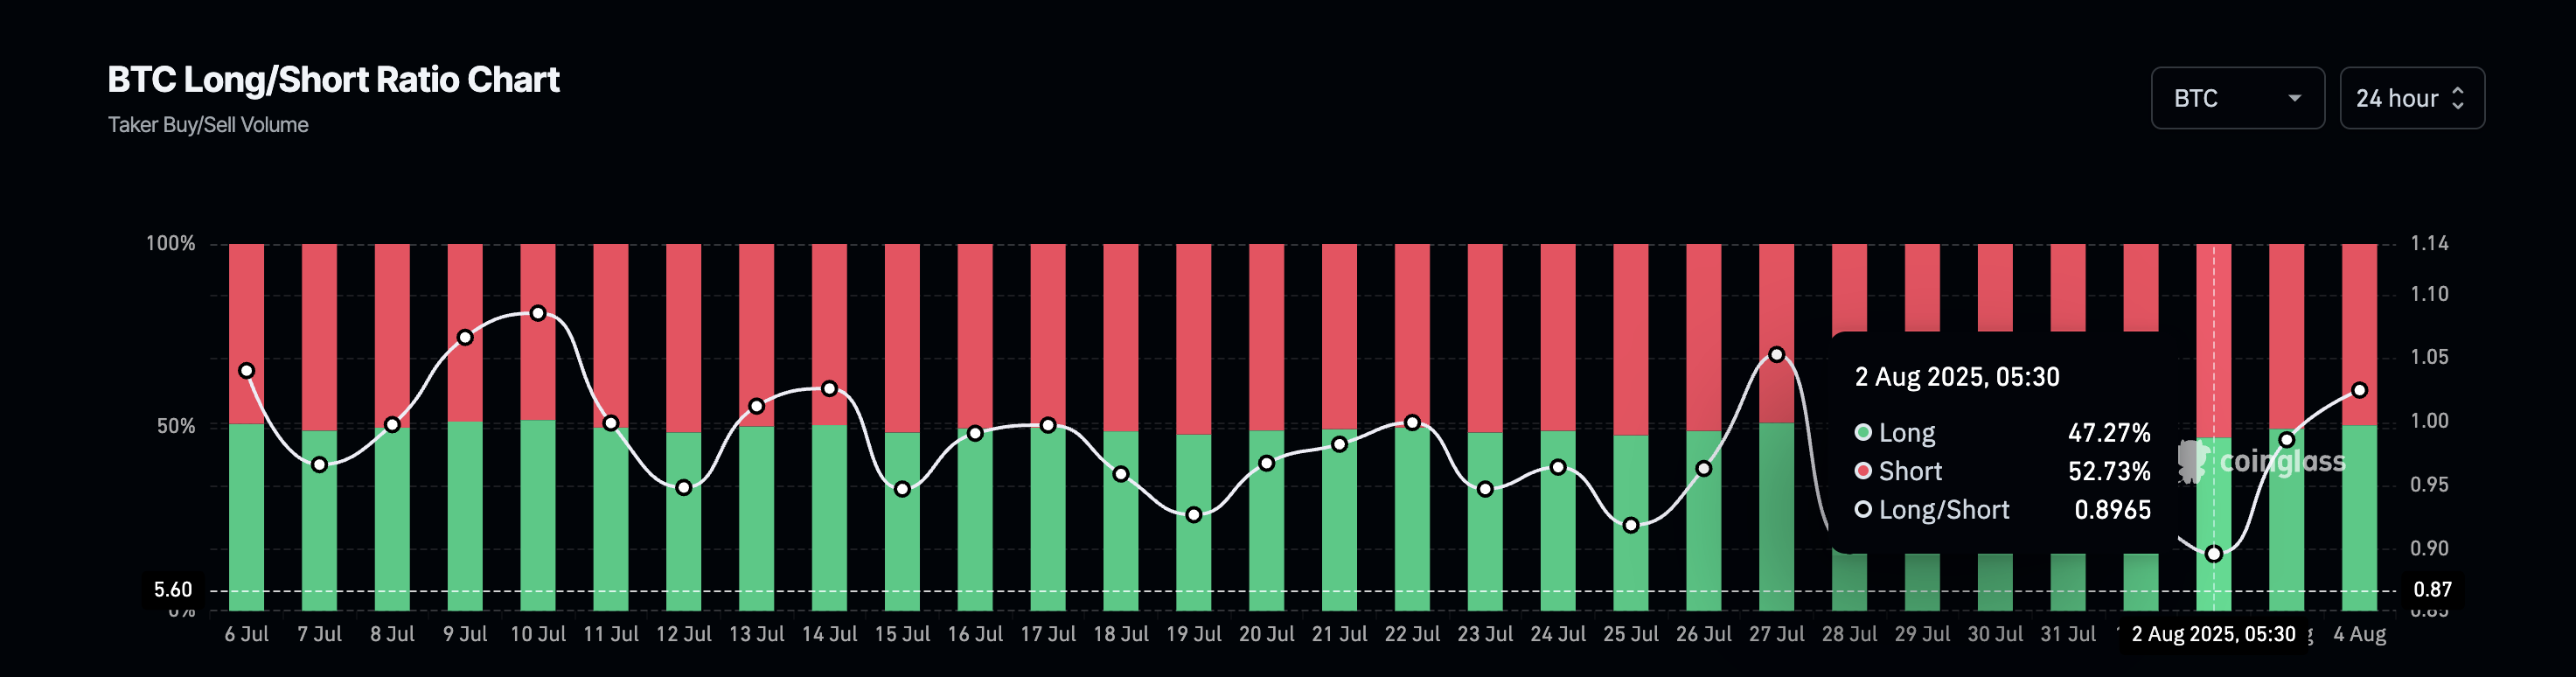 Bitcoin long-short ratio: Coinglass
The takeaway? We’re in the same pocket; supply pressure is slowing, valuation is sitting at a launch zone, and traders are quietly getting ready.
Bitcoin Price Must Clear $117,000; Or It Risks Another Trap
On the chart, the Bitcoin price is holding just above the 0.382 Fibonacci retracement level at $113,600. That level was drawn from the June low of $98,000 to the all-time high of $123,000.
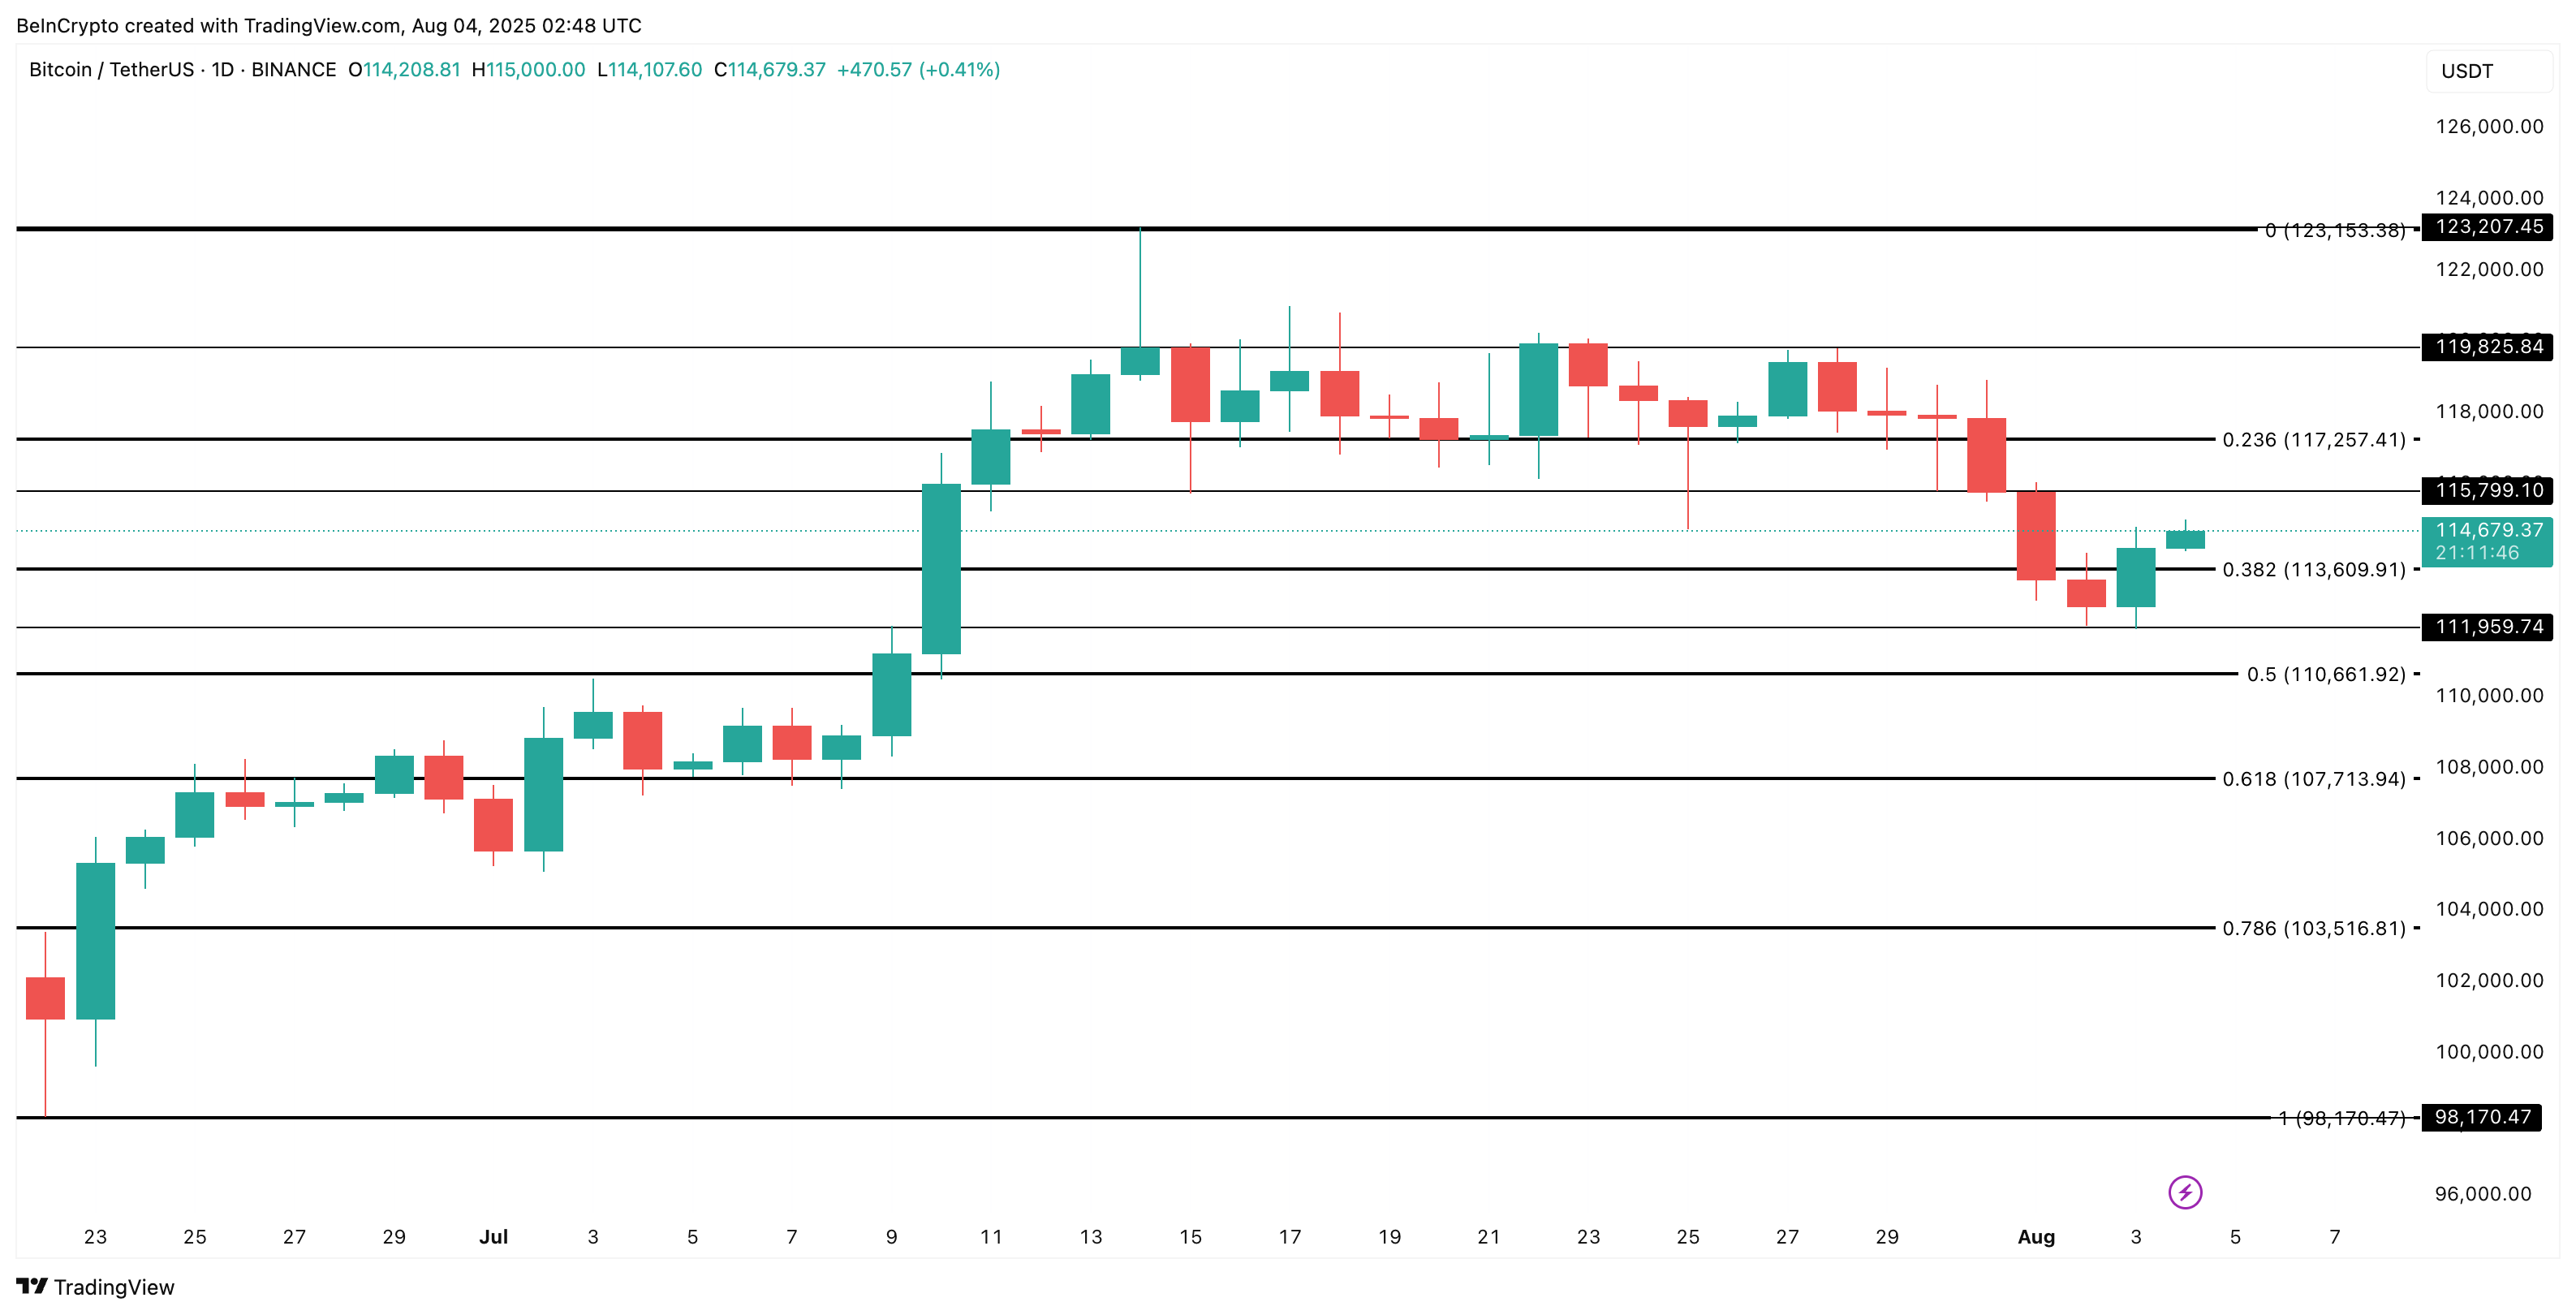 Bitcoin price analysis: TradingView
Below that, the BTC price support structure sits at $111,900 and $110,000. If bulls lose those levels, the next serious floor is down at $107,000, which also acts as the invalidation for the bullish setup.
But the big number everyone’s watching is $117,000. Per the chart, the zone above $117,000 has the maximum candle crowd, showing how important a support/resistance it is.
If the price can flip that level, it could trigger the next BTC rally. If not, we’re likely looking at another failed move in a choppy range.
Read more
* The content presented above, whether from a third party or not, is considered as general advice only. This article should not be construed as containing investment advice, investment recommendations, an offer of or solicitation for any transactions in financial instruments.


