January NFP Preview: Divergent Employment Outlook – Can Gold’s New Highs Be Sustained?

Mitrade
coverImg
Source: DepositPhotos

TradingKey - As the first nonfarm payrolls (NFP) report of 2025 approaches, the Federal Reserve’s rate cut prospects and markets such as gold and U.S. stocks face a critical test. Following unexpectedly strong ADP employment data, will the NFP report show signs of cooling as anticipated?


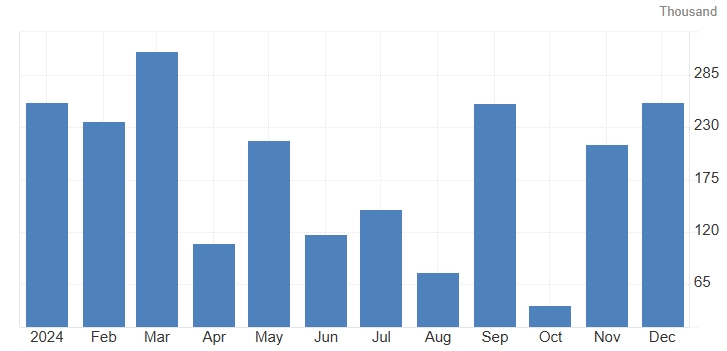
On Friday, February 7, the U.S. Bureau of Labor Statistics will release the January NFP report—the first since President Trump’s return to the White House. Economists generally expect nonfarm payrolls to have increased by 170,000, significantly lower than December 2024’s 256,000, with the unemployment rate holding steady at 4.1% and year-over-year wage growth easing slightly to 3.8%.

altText


[U.S. Nonfarm Payrolls (NFP), Source: Trading Economics]


TradingKey analyst Jason Tang agrees with the consensus forecast, citing the following factors:


  1. As a leading indicator, job openings in December last year stood at 7.6 million, nearly 500,000 lower than November, indicating that businesses are scaling back hiring efforts.

  2. The diminishing expectations of Federal Reserve rate cuts have a significant impact on the labor market. Higher interest rates are unfavorable for business expansion, leading to fewer new job opportunities.

  3. Seasonal factors also influence the U.S. hiring market. Generally, businesses tend to hire less aggressively during the winter months compared to other seasons.


Largest Annual Revision in History?


This report will include the U.S. Bureau of Labor Statistics' annual revisions, aligning employment data since March 2024 with quarterly unemployment insurance survey data.


In March last year, the Philadelphia Fed highlighted significant distortions in BLS employment data, sparking concerns over a "false employment prosperity." It indicated that NFP figures were overstated by 1.1 million from March to June 2022 and by 800,000 in 2023.


Goldman Sachs predicts that this NFP report will feature the largest revision in history, with:


- The total labor force increasing by 2.5 million

- Household employment rising by 2.3 million

- The labor force participation rate increasing by 11 basis points

- The unemployment rate rising by 4 basis points

Bloomberg economists estimate that revised average monthly employment growth for 2024 will be adjusted downward from 182,000 to 148,000.


Divergent Employment Growth Outlook


Economists believe that Trump’s pro-business policies will drive moderate U.S. economic growth, supporting a stable labor market.

Randstad NV, the world’s largest HR services provider, noted growing optimism in the U.S. regarding deregulation, innovation, and new technologies—factors that could boost hiring.

However, recent employment data shows mixed signals:

- ADP employment for January rose to 183,000, the highest since October 2024, exceeding forecasts of 150,000 and up from 122,000 in December.

- December JOLTS figures came in at 7.6 million, below market expectations of 8 million, while the hiring rate remained at 3.4% for three consecutive months—lower than the pre-pandemic 3.9% in February 2020.

- A recent Gallup survey found that 38% of Americans expect unemployment to rise, while another 38% anticipate a decline.


Rate Cut Prospects and Asset Performance


A strong NFP report could reduce the likelihood of Federal Reserve rate cuts, pressuring gold and U.S. stocks. Conversely, weaker employment data could bolster rate cut expectations, supporting risk assets.


Richmond Fed President Barkin cautioned that heightened policy uncertainty under Trump’s second term requires more time to assess the U.S. economy, employment, and inflation. He expects stable employment and spending but remains skeptical about business investment due to economic unknowns.

Recently, gold prices have repeatedly hit record highs, driven by policy uncertainty, currently trading at $2,865.50 per ounce.


Federal Reserve officials highlighted that Trump-era policy uncertainties, particularly on tariffs, pose one of the biggest challenges for future monetary policy.

ANZ strategists suggest that gold could soon reach $3,000, though a resolution in trade tensions could lead to price corrections.

Read more

  • Gold Price Forecast: Gold Tumbles Below $3,900 as Trump Says No Need for Iran Deal; Can October PPI Spur a Rebound?
  • * The content presented above, whether from a third party or not, is considered as general advice only.  This article should not be construed as containing investment advice, investment recommendations, an offer of or solicitation for any transactions in financial instruments.

    goTop
    quote
    Related Articles
    placeholder
    Gold Price Forecast: Gold Tumbles Below $3,900 as Trump Says No Need for Iran Deal; Can October PPI Spur a Rebound? As of the Asian session on Friday (November 13), gold prices (XAUUSD) rebounded intraday following Thursday's sharp decline, trading near $3,910. Previously, gold tumbled 2.76% on Thursda
    Author  TradingKey
    Nov 13, Fri
    As of the Asian session on Friday (November 13), gold prices (XAUUSD) rebounded intraday following Thursday's sharp decline, trading near $3,910. Previously, gold tumbled 2.76% on Thursda
    placeholder
    Gold hit a one-year low while central banks bought 321 tonnes — the sellers were never the ones you thinkSpot gold closed at 3,876 on Thursday, down 2.8% and its lowest close in more than a year, with an intraday low near 3,852. The dollar is at a 19-month high of 103.21 and the 10-year yield is at 5.10%, so the price move is easy to explain. What is harder to explain is who sold: central banks bought 321 tonnes in Q3, the PBoC added for a 24th straight month, ETF holdings are near a record 4,256 tonnes, and roughly 95% of the futures selling came from non-reportable and sovereign-type accounts rather than hedge funds. This piece separates the two books that have to balance.
    Author  Irene Q.
    Nov 13, Fri
    Spot gold closed at 3,876 on Thursday, down 2.8% and its lowest close in more than a year, with an intraday low near 3,852. The dollar is at a 19-month high of 103.21 and the 10-year yield is at 5.10%, so the price move is easy to explain. What is harder to explain is who sold: central banks bought 321 tonnes in Q3, the PBoC added for a 24th straight month, ETF holdings are near a record 4,256 tonnes, and roughly 95% of the futures selling came from non-reportable and sovereign-type accounts rather than hedge funds. This piece separates the two books that have to balance.
    placeholder
    US October PPI Preview: Fed Rate Hike Expectations Rise, PPI May Be Key Variable; How Will US Stocks, Dollar, and Gold Move?On Friday (Nov. 13) Eastern Time, the U.S. will release the October Producer Price Index (PPI). Following the October CPI once again exceeding expectations, the market will look to the PP
    Author  TradingKey
    Nov 12, Thu
    On Friday (Nov. 13) Eastern Time, the U.S. will release the October Producer Price Index (PPI). Following the October CPI once again exceeding expectations, the market will look to the PP
    placeholder
    Gold closed below $4,000 again — the ETF crowd and central banks stayed, the momentum money leftSpot gold is trading near $3,999, its third consecutive lower daily low, after a 5.00% 10-year yield and a 102.85 dollar index raised the odds of a December hike to 87%. But the selling is not coming from the strategic holders: managed-money net longs fell to 324 tonnes, a 21-week low, and Goldman Sachs attributes roughly 95% of five weeks of selling to non-reportable positions. ETFs still hold a record 4,256 tonnes and central banks bought 321 tonnes in Q3. The table below sets the triggers, directions and levels.
    Author  Irene Q.
    Nov 12, Thu
    Spot gold is trading near $3,999, its third consecutive lower daily low, after a 5.00% 10-year yield and a 102.85 dollar index raised the odds of a December hike to 87%. But the selling is not coming from the strategic holders: managed-money net longs fell to 324 tonnes, a 21-week low, and Goldman Sachs attributes roughly 95% of five weeks of selling to non-reportable positions. ETFs still hold a record 4,256 tonnes and central banks bought 321 tonnes in Q3. The table below sets the triggers, directions and levels.
    placeholder
    Gold Extends Slide Below $4,000 as Rising US Inflation, Fed December Hike Bets Pressure Prices On November 12, gold prices (XAUUSD) extended their recent losses, falling further below $4,000 in early Asian trading to hit an intraday low near $3,968, marking a third consecutive day
    Author  TradingKey
    Nov 12, Thu
    On November 12, gold prices (XAUUSD) extended their recent losses, falling further below $4,000 in early Asian trading to hit an intraday low near $3,968, marking a third consecutive day
    Live Quotes
    Name / SymbolChart% Change / Price
    XAUUSD
    XAUUSD
    0.00%0.00

    Gold Related Articles

    • 10 Best Day Trading Platforms for Beginners and Active Traders in 2026: A Practical Guide
    • What is Gold CFD? How to Trade Gold CFD With Mitrade Example
    • ​5 Best Paper Trading Platforms for 2026 (Free Demo Accounts for Beginners & Traders)
    • XAU/USD Gold Price Trend Analysis 2026: Will It Keep Rising?
    • Is Mitrade Right for You? A Complete Guide on How to Start Trading CFDs in 5 Steps
    • How and Where to Buy Gold in Australia? A Complete Guide for Beginners

    Click to view more