
Top 3 Price Prediction: Bitcoin, Ethereum, Ripple – BTC struggles near $108,000, ETH and XRP extend correction

- Silver Price Forecast: XAG/USD surges to record high above $56 amid bullish momentum
- Fed Chair Candidate: What Would a Hassett Nomination Mean for U.S. Stocks?
- The 2026 Fed Consensus Debate: Not Hassett, It’s About Whether Powell Stays or Goes
- U.S. PCE and 'Mini Jobs' Data in Focus as Salesforce (CRM) and Snowflake (SNOW) Report Earnings 【The week ahead】
- AUD/USD holds steady below 0.6550 as traders await Australian GDP release
- AUD/USD sticks to gains above 0.6600, highest since late October after Aussie trade data

Bitcoin price hovers around $108,800 on Friday after falling more than 5% so far this week.
Ethereum continues its correction after retesting daily resistance at $4,232 earlier in the week.
XRP closes below the daily support at $2.35, signaling potential for further downside ahead.
Bitcoin (BTC), Ethereum (ETH), and Ripple (XRP) remain under pressure at the time of writing on Friday after extending the losses nearly 5%, 6%, and 7%, respectively. BTC struggles near $108,000 while ETH and XRP close below their key supports, suggesting the potential for further downside in the near term.
Bitcoin closes below the ascending trendline
Bitcoin price faced rejection from the 50-day Exponential Moving Average (EMA) at $114,822 on Tuesday and declined by nearly 6% until Thursday, closing below the ascending trendline. At the time of writing on Friday, BTC hovers at around $109,000.
If BTC continues its correction and closes below the 200-day EMA at $108,070, it could extend the decline toward the October 10 low of $102,000.
The Relative Strength Index (RSI) indicator at 39 on the daily chart suggests that bearish momentum is gaining traction. Additionally, the Moving Average Convergence Divergence (MACD) showed a bearish crossover last week, which remains in effect, further supporting the bearish view.
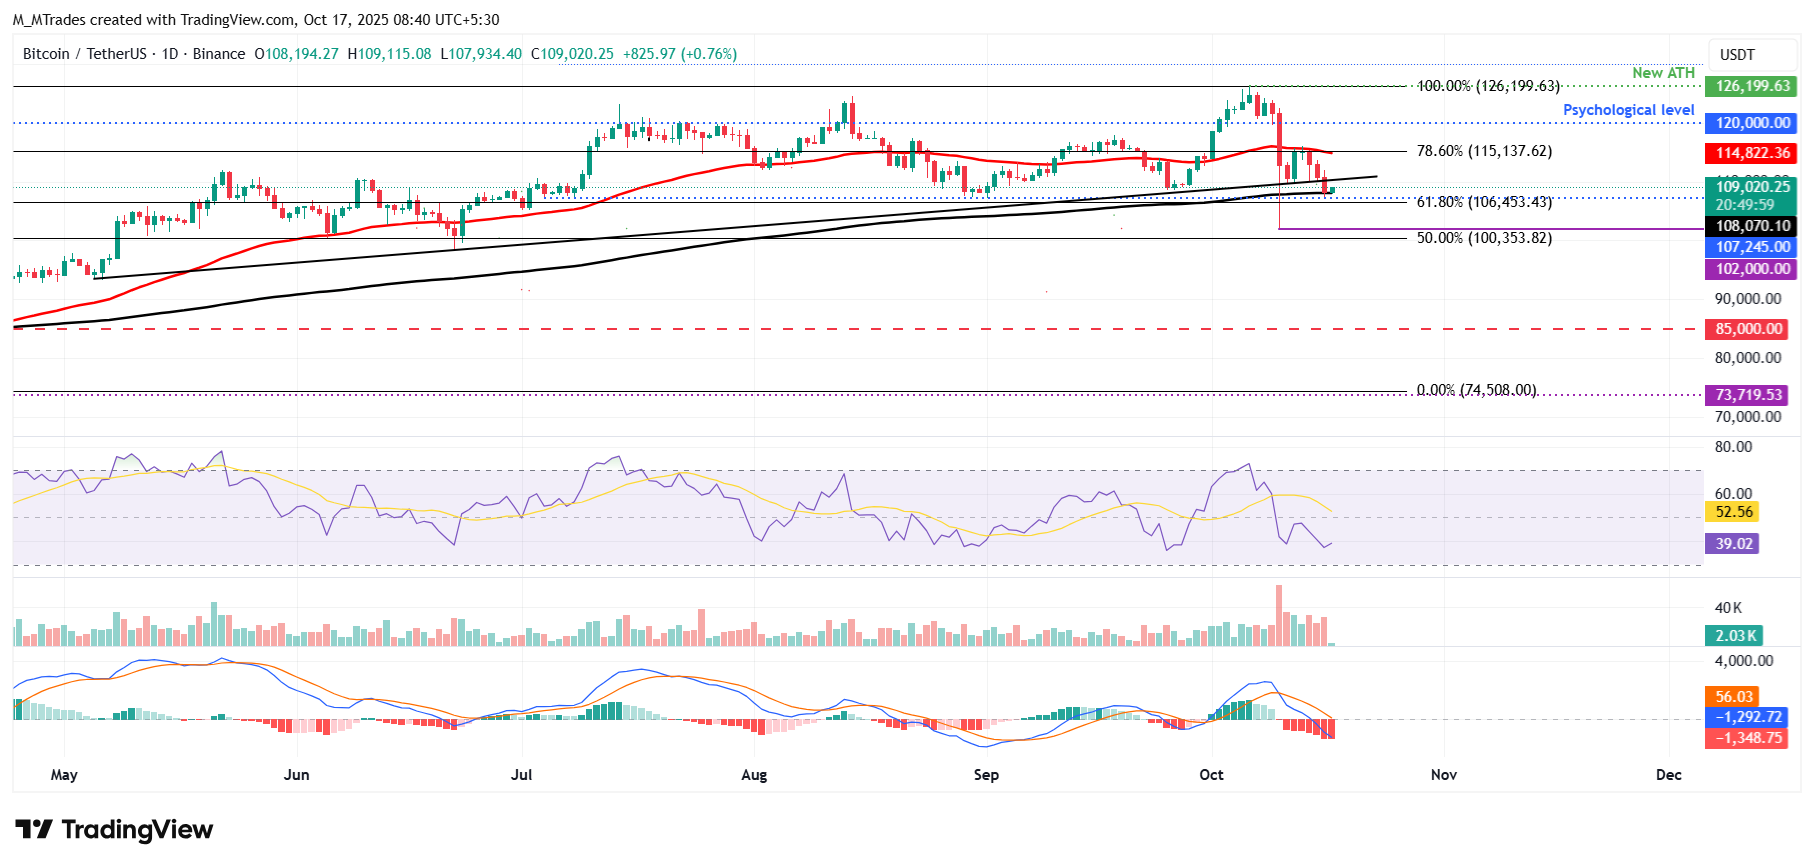
BTC/USDT daily chart
On the other side, if BTC recovers, it could extend the recovery toward the 50-day EMA at $114,822.
Ethereum bears are in control of the momentum
Ethereum price faced rejection from the daily resistance level at $4,232, which roughly coincides with the 50-day EMA and the 78.6% Fibonacci retracement level on Tuesday and declined 8.88% by Thursday. At the time of writing on Friday, ETH hovers around $3,900.
If ETH continues its pullback, it could extend the decline toward the 61.8% Fibonacci retracement level at $3,953.
Like Bitcoin, Ethereum’s RSI and MACD indicators also support the bearish view.
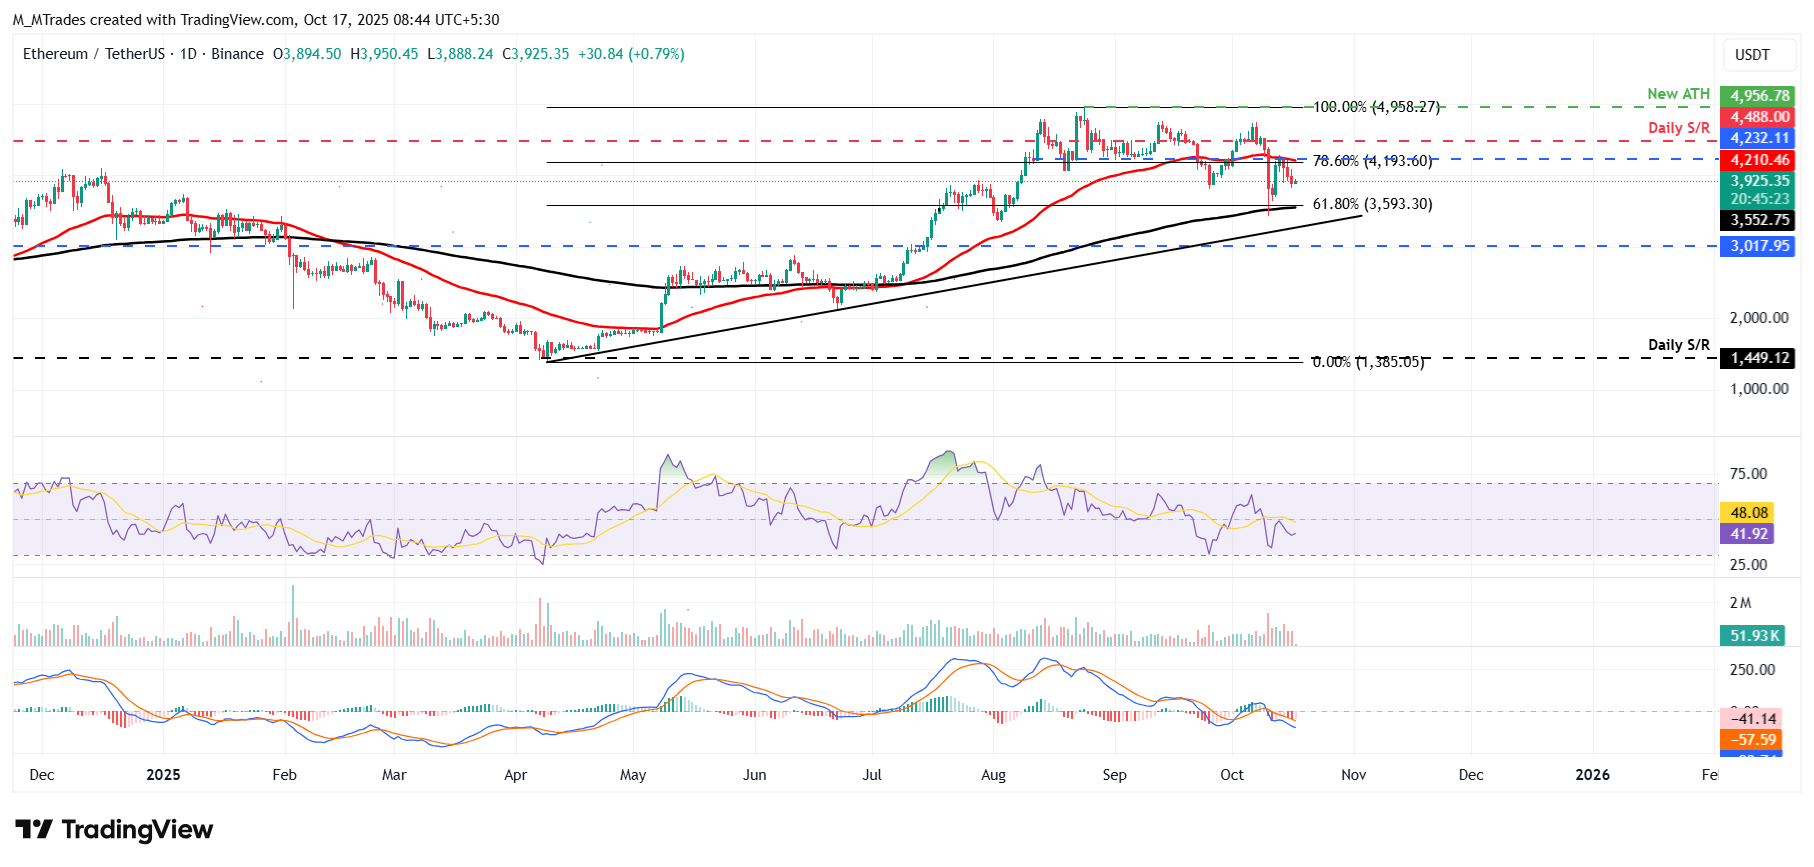
ETH/USDT daily chart
However, if ETH recovers, it could extend the recovery toward the daily resistance level at $4,232.
XRP shows weakness in momentum
Ripple price found resistance around the lower trendline of a falling wedge pattern on Tuesday and declined nearly 11% by Thursday, closing below the daily support at $2.35. At the time of writing on Friday, XRP hovers around $2.35.
If XRP continues its correction, it could extend the decline toward the next daily support at $1.96.
Like Bitcoin and Ethereum, XRP’s momentum indicators, RSI and MACD, also support the bearish view.
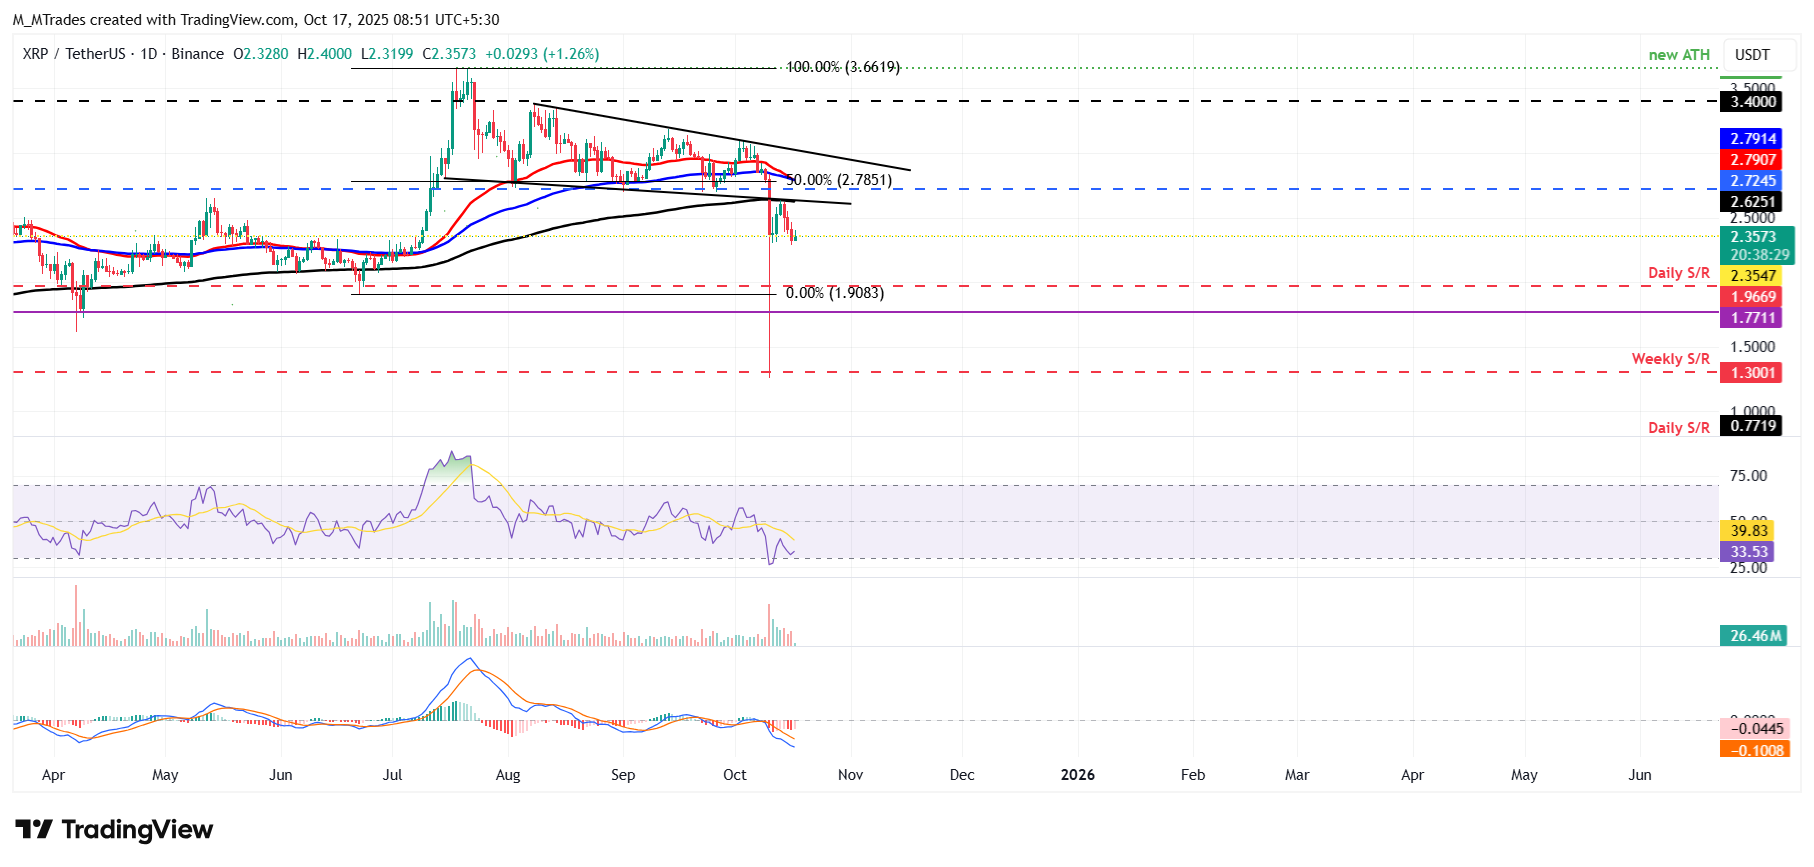
XRP/USDT daily chart
On the other hand, if XRP recovers, it could extend the recovery toward the 200-day EMA at $2.62.
Read more
* The content presented above, whether from a third party or not, is considered as general advice only. This article should not be construed as containing investment advice, investment recommendations, an offer of or solicitation for any transactions in financial instruments.


