




Top 3 Price Prediction: Bitcoin, Ethereum, Ripple – BTC extends recovery, ETH eyes $2,500, XRP holds $1.30
- Bitcoin extends its recovery, trading above $76,700 on Friday.
- Ethereum is heading toward key resistance around $2,500, a breakthrough could suggest further gains.
- XRP finds support around the key level at $1.300, with a sustained hold supporting a recovery.
Bitcoin (BTC), Ethereum (ETH) and Ripple (XRP) extend their recovery, trading above $76,700, $2,400 and $1.300, respectively, on Friday. These top three cryptocurrencies now face key technical levels that could determine whether their recoveries extend further or pull back.
Bitcoin extends rebound
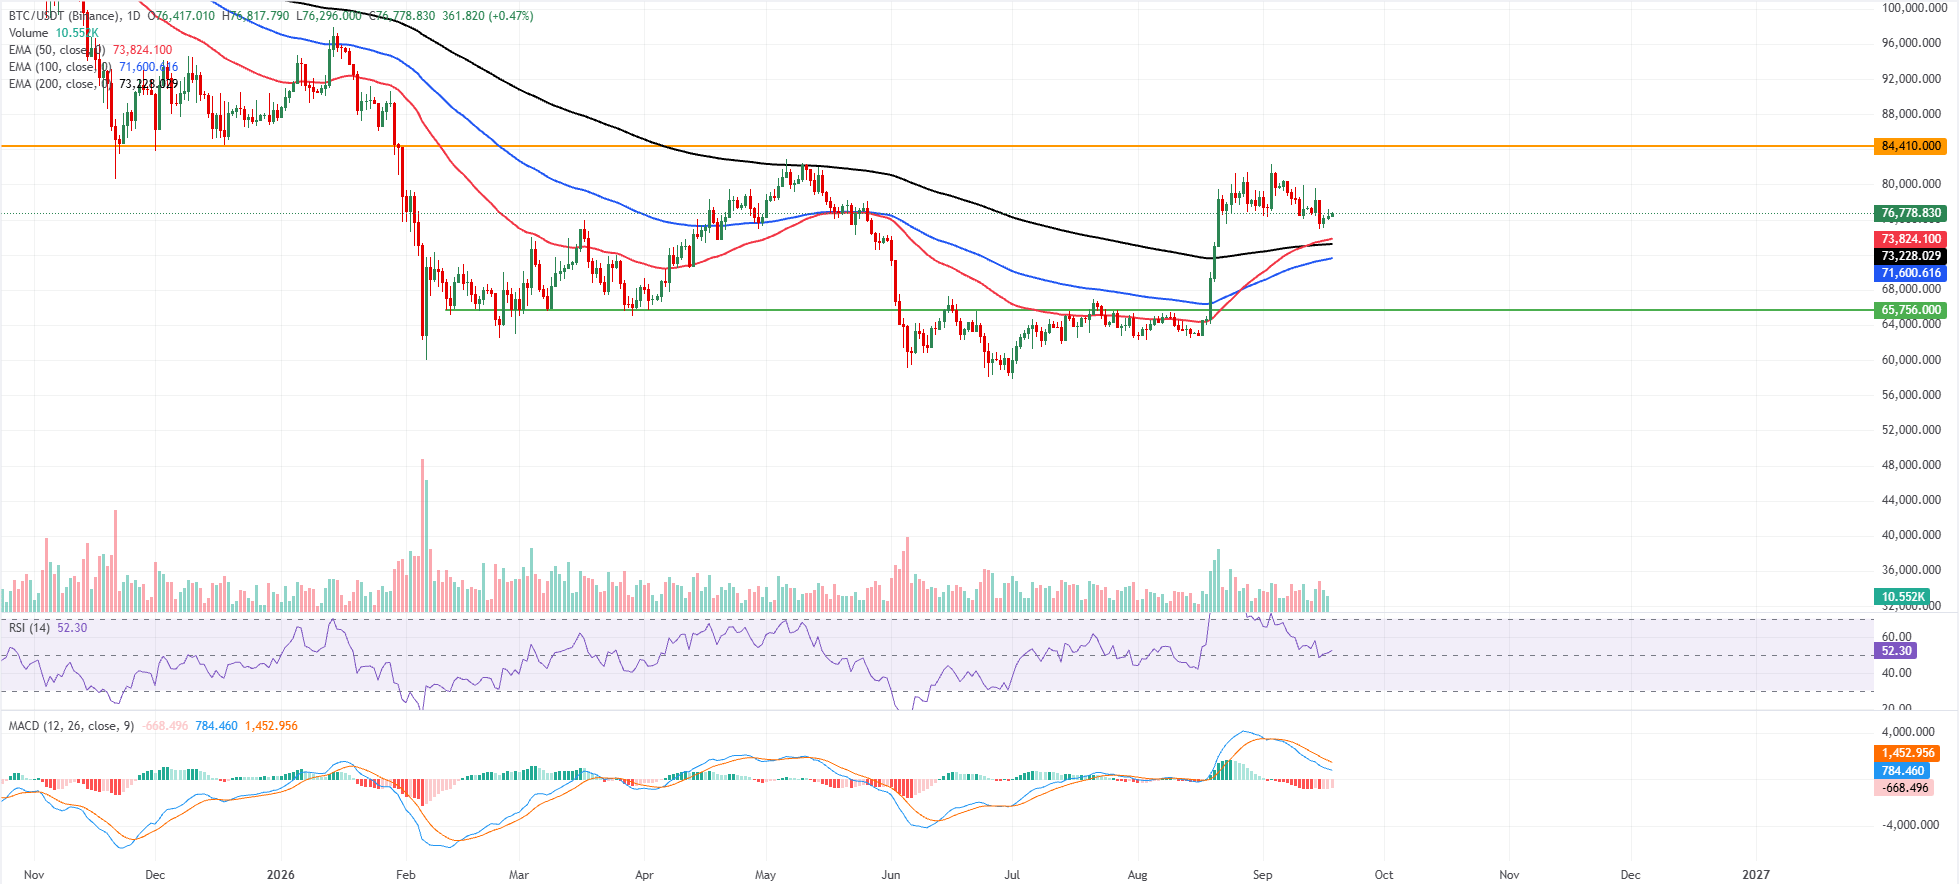
Bitcoin price trades at $76,770 on Friday, holding a bullish near-term bias as it remains comfortably above the 50-day, 100-day and 200-day Exponential Moving Averages (EMAs) clustered between roughly $71,600 and $73,824.
The Relative Strength Index (RSI) at 52 has eased back to neutral territory from prior overbought extremes. At the same time, the Moving Average Convergence Divergence (MACD) stays in negative territory with a contracting downside profile, hinting at waning bearish momentum rather than an outright trend reversal.
On the topside, the next notable resistance is the horizontal barrier at $84,410, where prior supply could re-emerge if the rally extends.
On the downside, initial demand is expected around the 50-day EMA at $73,824, reinforced by the 200-day EMA at $73,228 and the 100-day EMA down at $71,600. These levels collectively underpin the broader uptrend as long as price trades above them.
Ethereum could extend gains if it closes above key levels
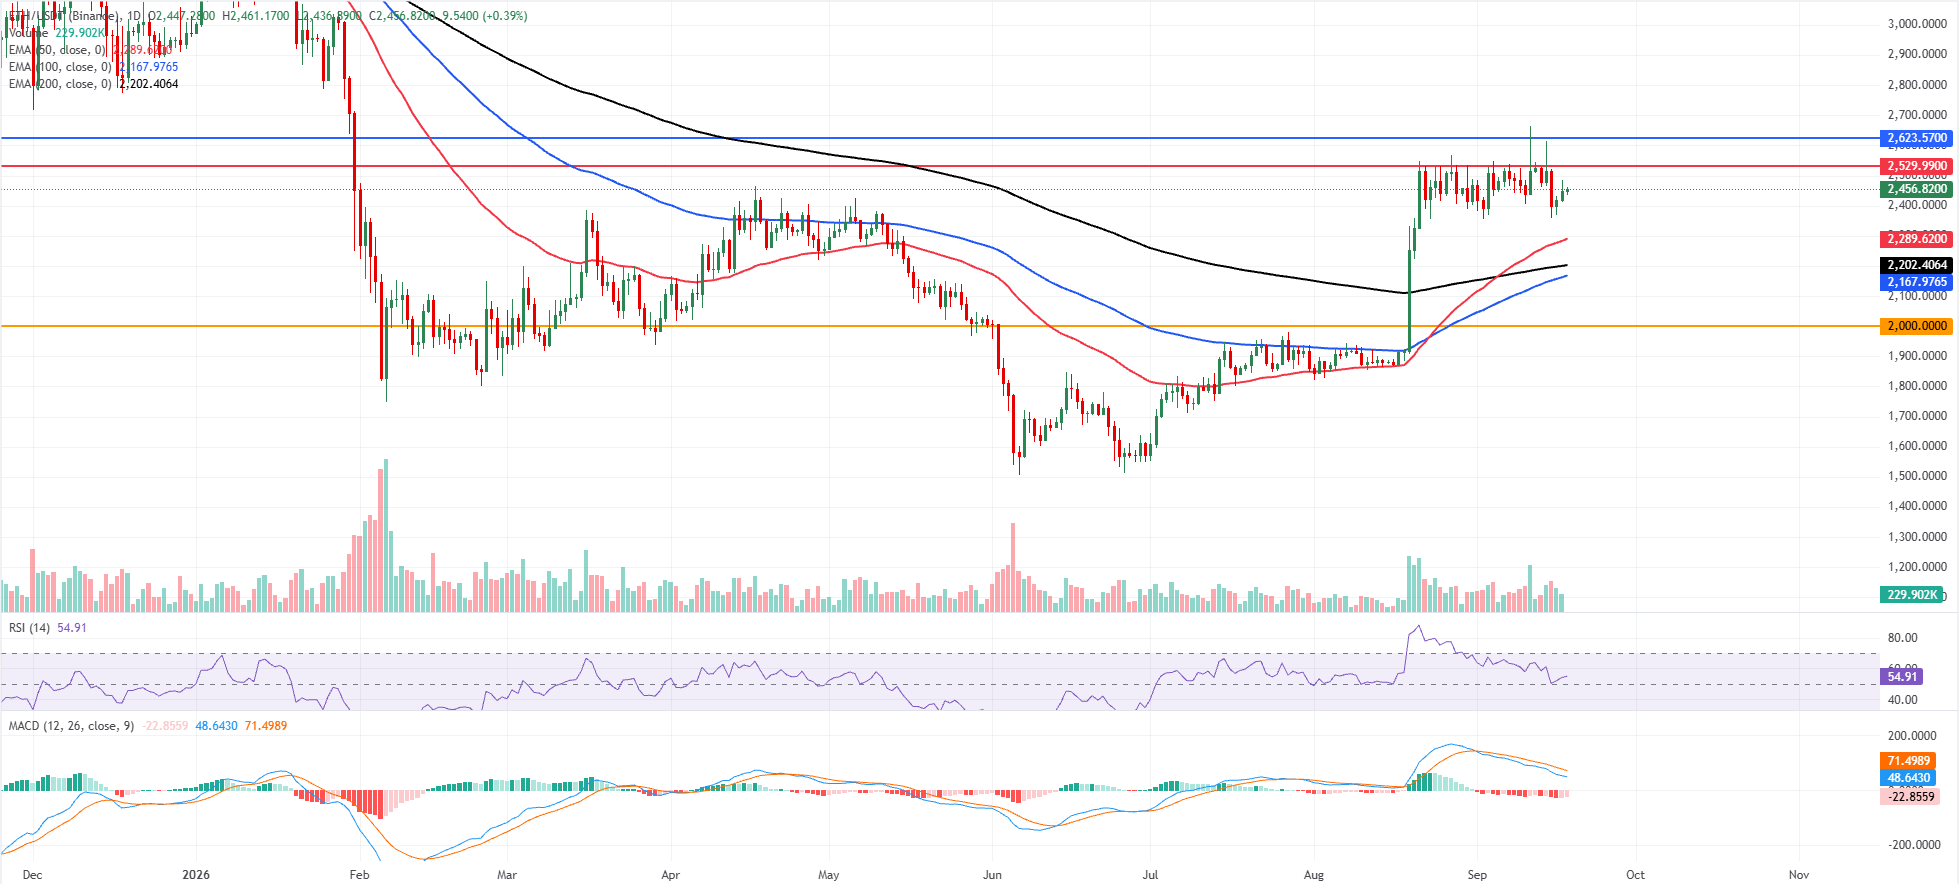
Ethereum price trades at $2,456 on Friday, holding a broadly bullish near-term bias as it remains well above the 50-day, 100-day and 200-day Exponential Moving Averages (EMAs), clustered between roughly $2,170 and $2,290 and reinforcing an underlying uptrend structure.
The RSI at 54 has cooled from earlier overbought extremes and now sits in neutral territory. At the same time, the MACD remains below zero, hinting that momentum is still in a corrective phase even as the broader trend stays supported.
On the topside, initial resistance is seen at the horizontal barrier near $2,529, ahead of a higher resistance level at $2,623, where buying pressure would likely be tested again if the recovery extends.
On the downside, immediate technical demand is reinforced by the 50-day EMA at $2,289, followed by the 200-day EMA at $2,202 and the 100-day EMA at $2,167. At the same time, a deeper pullback would look toward the prior horizontal floor around $2,000 as a more significant medium-term support zone.
XRP holds key support zone
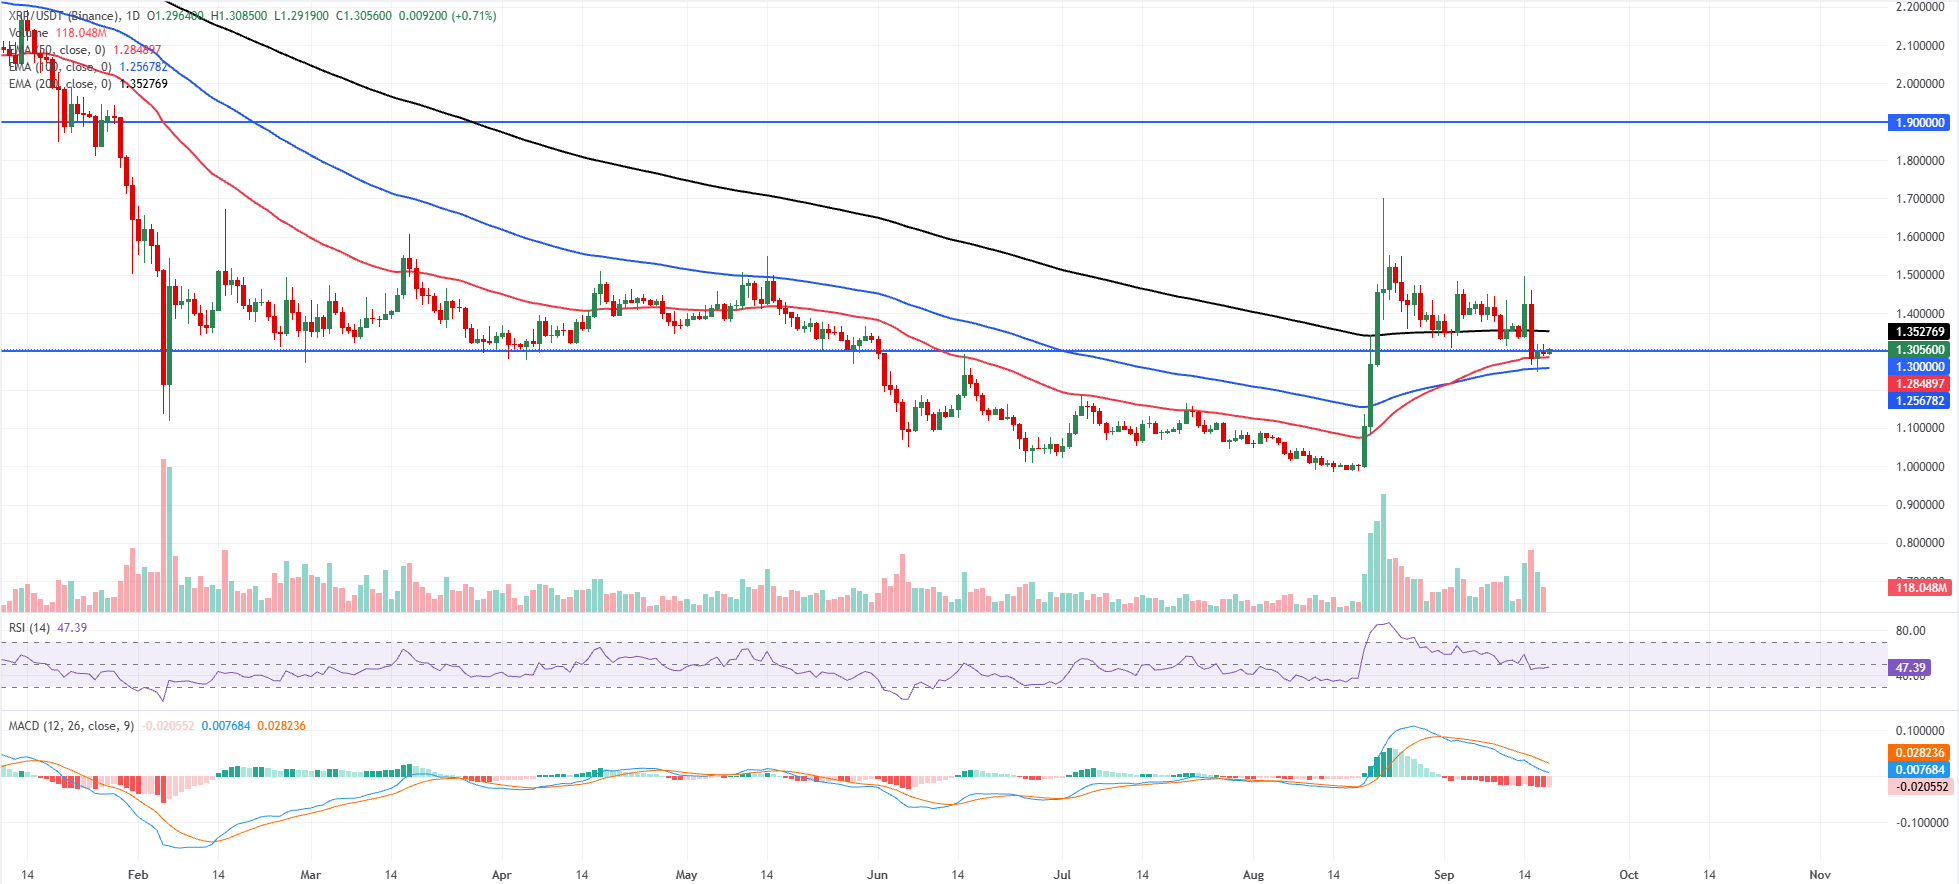
XRP price trades at $1.305 on Friday, hovering just above the $1.300 horizontal support and sitting between its medium- and long-term EMAs.
The 50-day EMA at $1.284 and 100-day EMA at $1.256 sit below price and suggest an underlying constructive tone, but the 200-day EMA at $1.352 overhead caps the upside and keeps the broader bias neutral for now.
The RSI at 47 is near the midline, reinforcing a consolidative backdrop. At the same time, the MACD indicator holds in negative territory with a slightly negative reading, hinting at fading bullish momentum rather than outright selling pressure.
On the downside, immediate support is seen at the $1.300 horizontal level, with the 50-day EMA at $1.284 and the 100-day EMA at $1.256 providing deeper technical cushions if sellers extend the pullback.
On the topside, initial resistance comes at the 200-day EMA at $1.352, and only a sustained break above this barrier would open the way toward the more distant horizontal resistance near $1.900, where a prior supply zone could reassert itself.
(The technical analysis of this story was written with the help of an AI tool. Know more.)
Cryptocurrency prices FAQs
Token launches influence demand and adoption among market participants. Listings on crypto exchanges deepen the liquidity for an asset and add new participants to an asset’s network. This is typically bullish for a digital asset.
A hack is an event in which an attacker captures a large volume of the asset from a DeFi bridge or hot wallet of an exchange or any other crypto platform via exploits, bugs or other methods. The exploiter then transfers these tokens out of the exchange platforms to ultimately sell or swap the assets for other cryptocurrencies or stablecoins. Such events often involve an en masse panic triggering a sell-off in the affected assets.
Macroeconomic events like the US Federal Reserve’s decision on interest rates influence crypto assets mainly through the direct impact they have on the US Dollar. An increase in interest rate typically negatively influences Bitcoin and altcoin prices, and vice versa. If the US Dollar index declines, risk assets and associated leverage for trading gets cheaper, in turn driving crypto prices higher.
Halvings are typically considered bullish events as they slash the block reward in half for miners, constricting the supply of the asset. At consistent demand if the supply reduces, the asset’s price climbs.
Recommended Articles


