




Best ASX Gold Stocks to Watch in Q4 2026 as Gold Slides Into a Bear Market

Nine months ago, gold looked unstoppable. It hit a record of US$5,589 an ounce on January 28, and ASX gold stocks rode the rally higher.
Today the picture looks very different. Gold trades near US$4,125, a fall of about 26% from that peak, and it slipped to US$4,086 on October 7, its weakest level in about two months.
Yet the best ASX gold stocks have not collapsed with the metal. Some are barely lower for the year, because even at today's prices most miners still earn healthy margins on every ounce they produce.
This guide covers why gold has fallen, which gold stocks are holding up best, and the reporting dates that will test them in October. Mitrade, regulated by ASIC, lets Australian traders go long or short on gold and the major gold miners from one zero commission account.
What Is Happening to Gold in Q4 2026
A bear market is a fall of 20% or more from a recent peak, and gold entered one in 2026 after dropping about 26% from its January 28 record of US$ 5,589 to around US$4,125.
Gold closed 2025 at US$4,368 an ounce after a 67% annual gain. At today's price, it is now down about 6% for 2026.
The main pressure comes from the US Federal Reserve. The Fed raised rates in September, and its latest minutes showed most officials expect another hike before the year ends.
Markets now price a 78.3% chance of a December hike, according to CME FedWatch. Higher rates make gold less attractive because it pays no yield.
A stronger US dollar adds to that pressure. When the dollar rises, gold becomes more expensive for buyers holding other currencies, which reduces global demand.
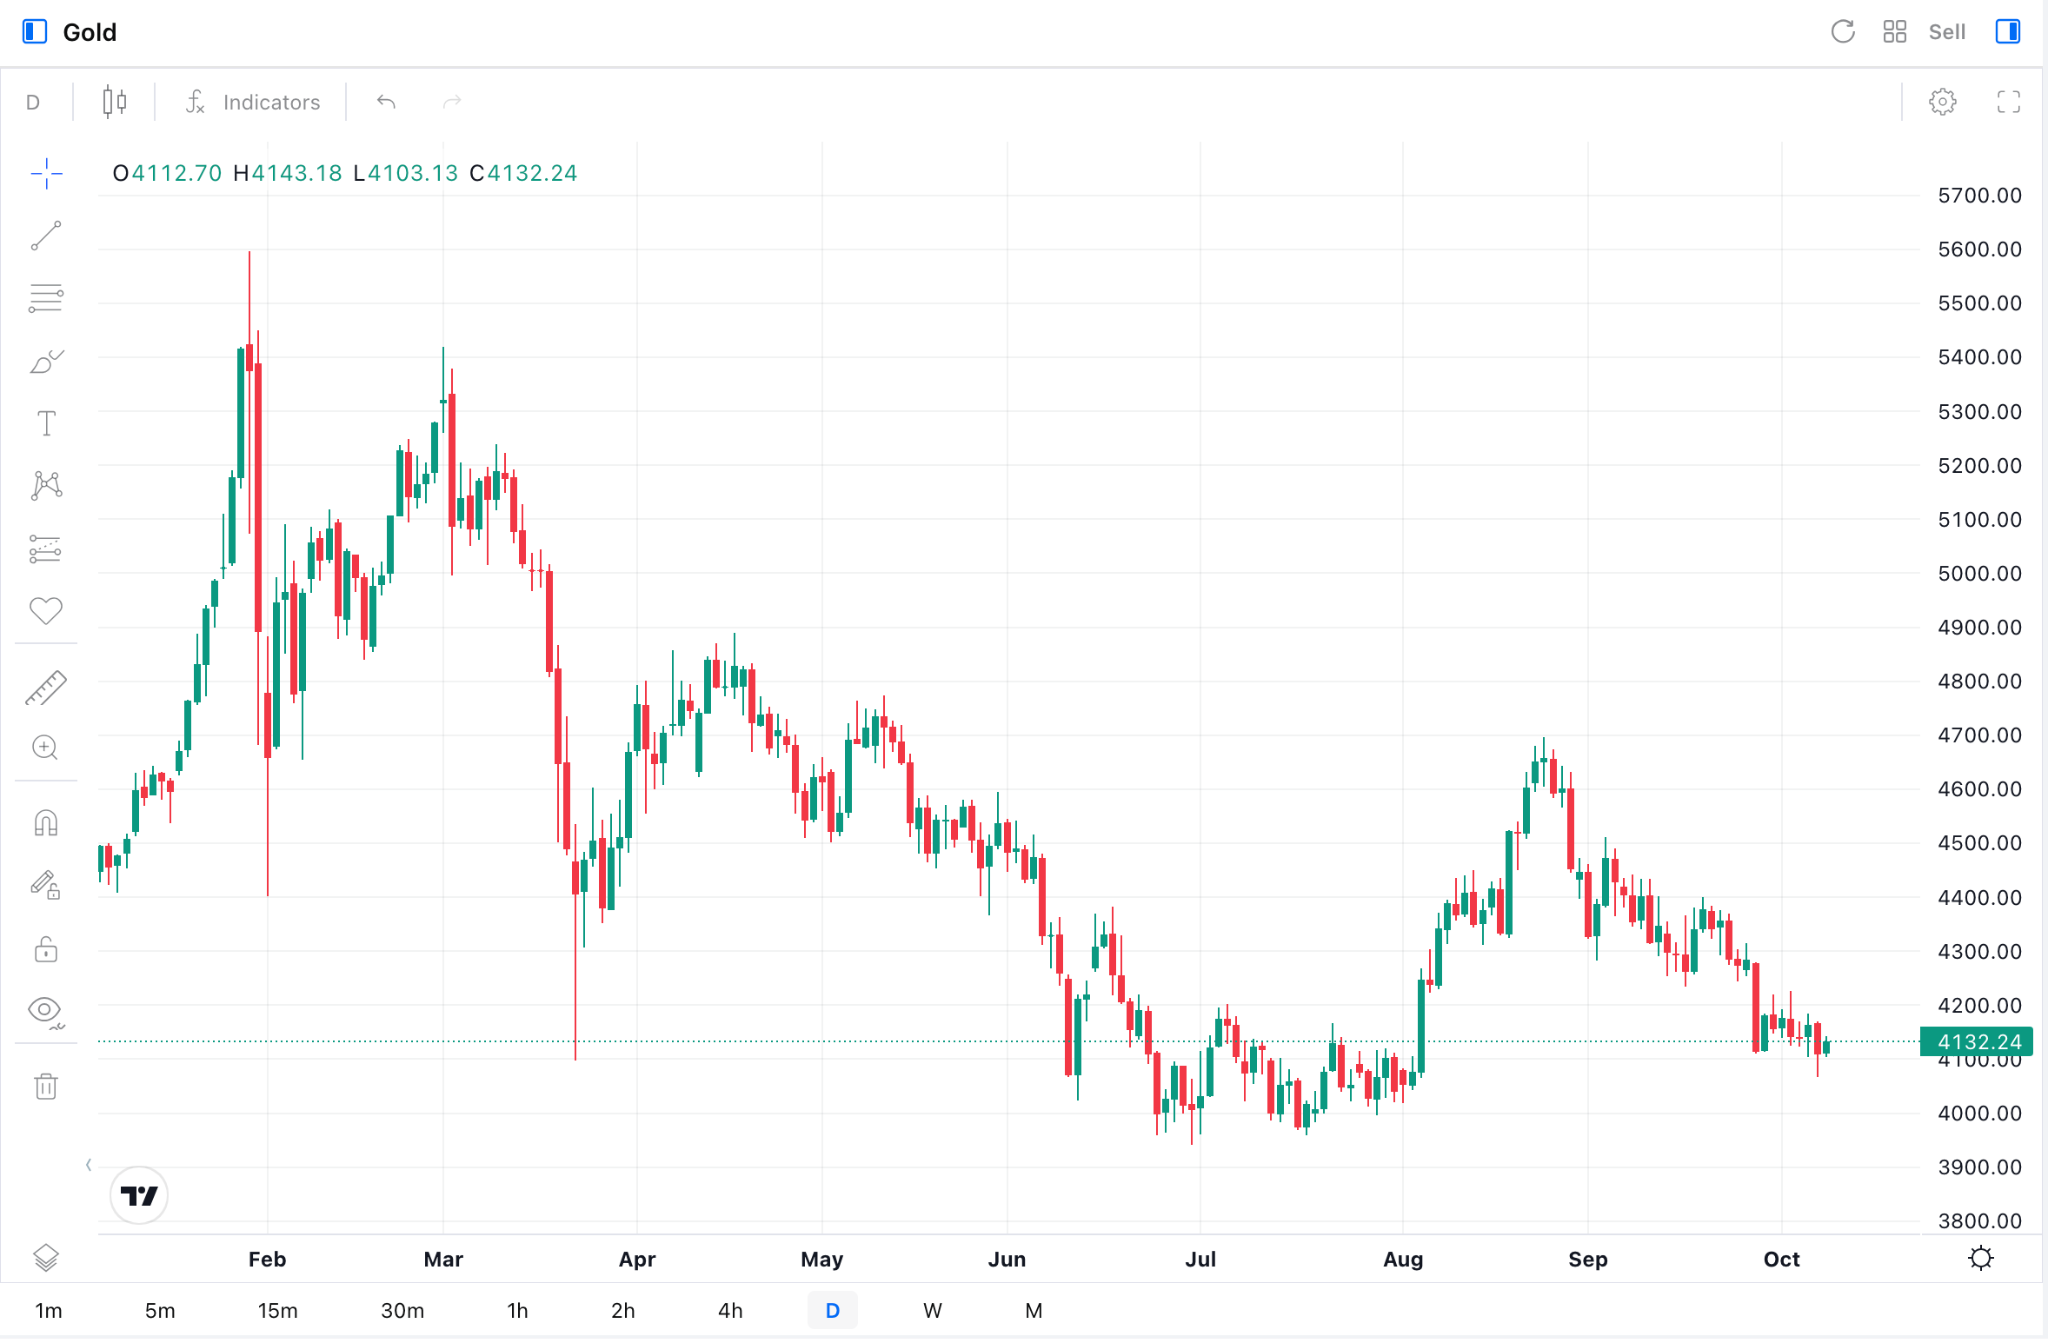
Image: Mitrade (Gold XAU/USD Daily Chart)
The chart shows how sharp the reversal has been. After the January peak, gold made a lower high in early March, then slid toward US$3,950 during June and July.
A late August rebound took gold back near US$4,700, but that rally failed in September. The June and July lows near US$3,950 now stand out as the next major support zone on the chart.
Why ASX Gold Miners Still Make Money at US$4,100
A falling gold price sounds like bad news for every gold miner. The key number to watch, though, is the gap between the gold price and the cost of producing each ounce.
That cost is measured by all in sustaining cost, or AISC. It covers mining, processing, royalties and the capital needed to keep a mine running.
Industry AISC averaged around US$1,785 an ounce in early 2026. Even with gold near US$4,125, that still leaves a margin of more than US$2,300 an ounce for a typical producer.
That margin is smaller than it was at the peak, and costs do not fall as quickly as prices. Royalties ease when gold drops, but labour, energy and equipment costs stay sticky.
Australian producers also have a currency buffer. Most of their costs are paid in Australian dollars, while gold is sold in US dollars.
The AUD/USD slipped to 0.6981 on October 6, back below the 0.70 level. A weaker local currency means each ounce sold in US dollars converts into more Australian dollars, which protects local margins.
This is why ASX gold stocks have held up better than gold itself. The market is now separating low cost producers with strong balance sheets from miners carrying high costs or heavy spending plans.
Northern Star Resources (NST)
Northern Star Resources (NST) is one of Australia's largest gold miners, with its flagship operations around Kalgoorlie in Western Australia. It reported a strong FY26 result in August.
Revenue rose 19% and net profit after tax climbed 24%, helped by a 26% jump in its average realised gold price. Gold sold slipped 6% to 1.54 million ounces.
The weak spot was free cash flow, which fell 56%. Northern Star is spending heavily on its KCGM mill expansion, which is designed to process up to 27 million tonnes a year.
For FY27, the company guides gold sold of 1.50 to 1.65 million ounces. It also runs an on market share buyback and pays its fully franked final dividend on October 15.
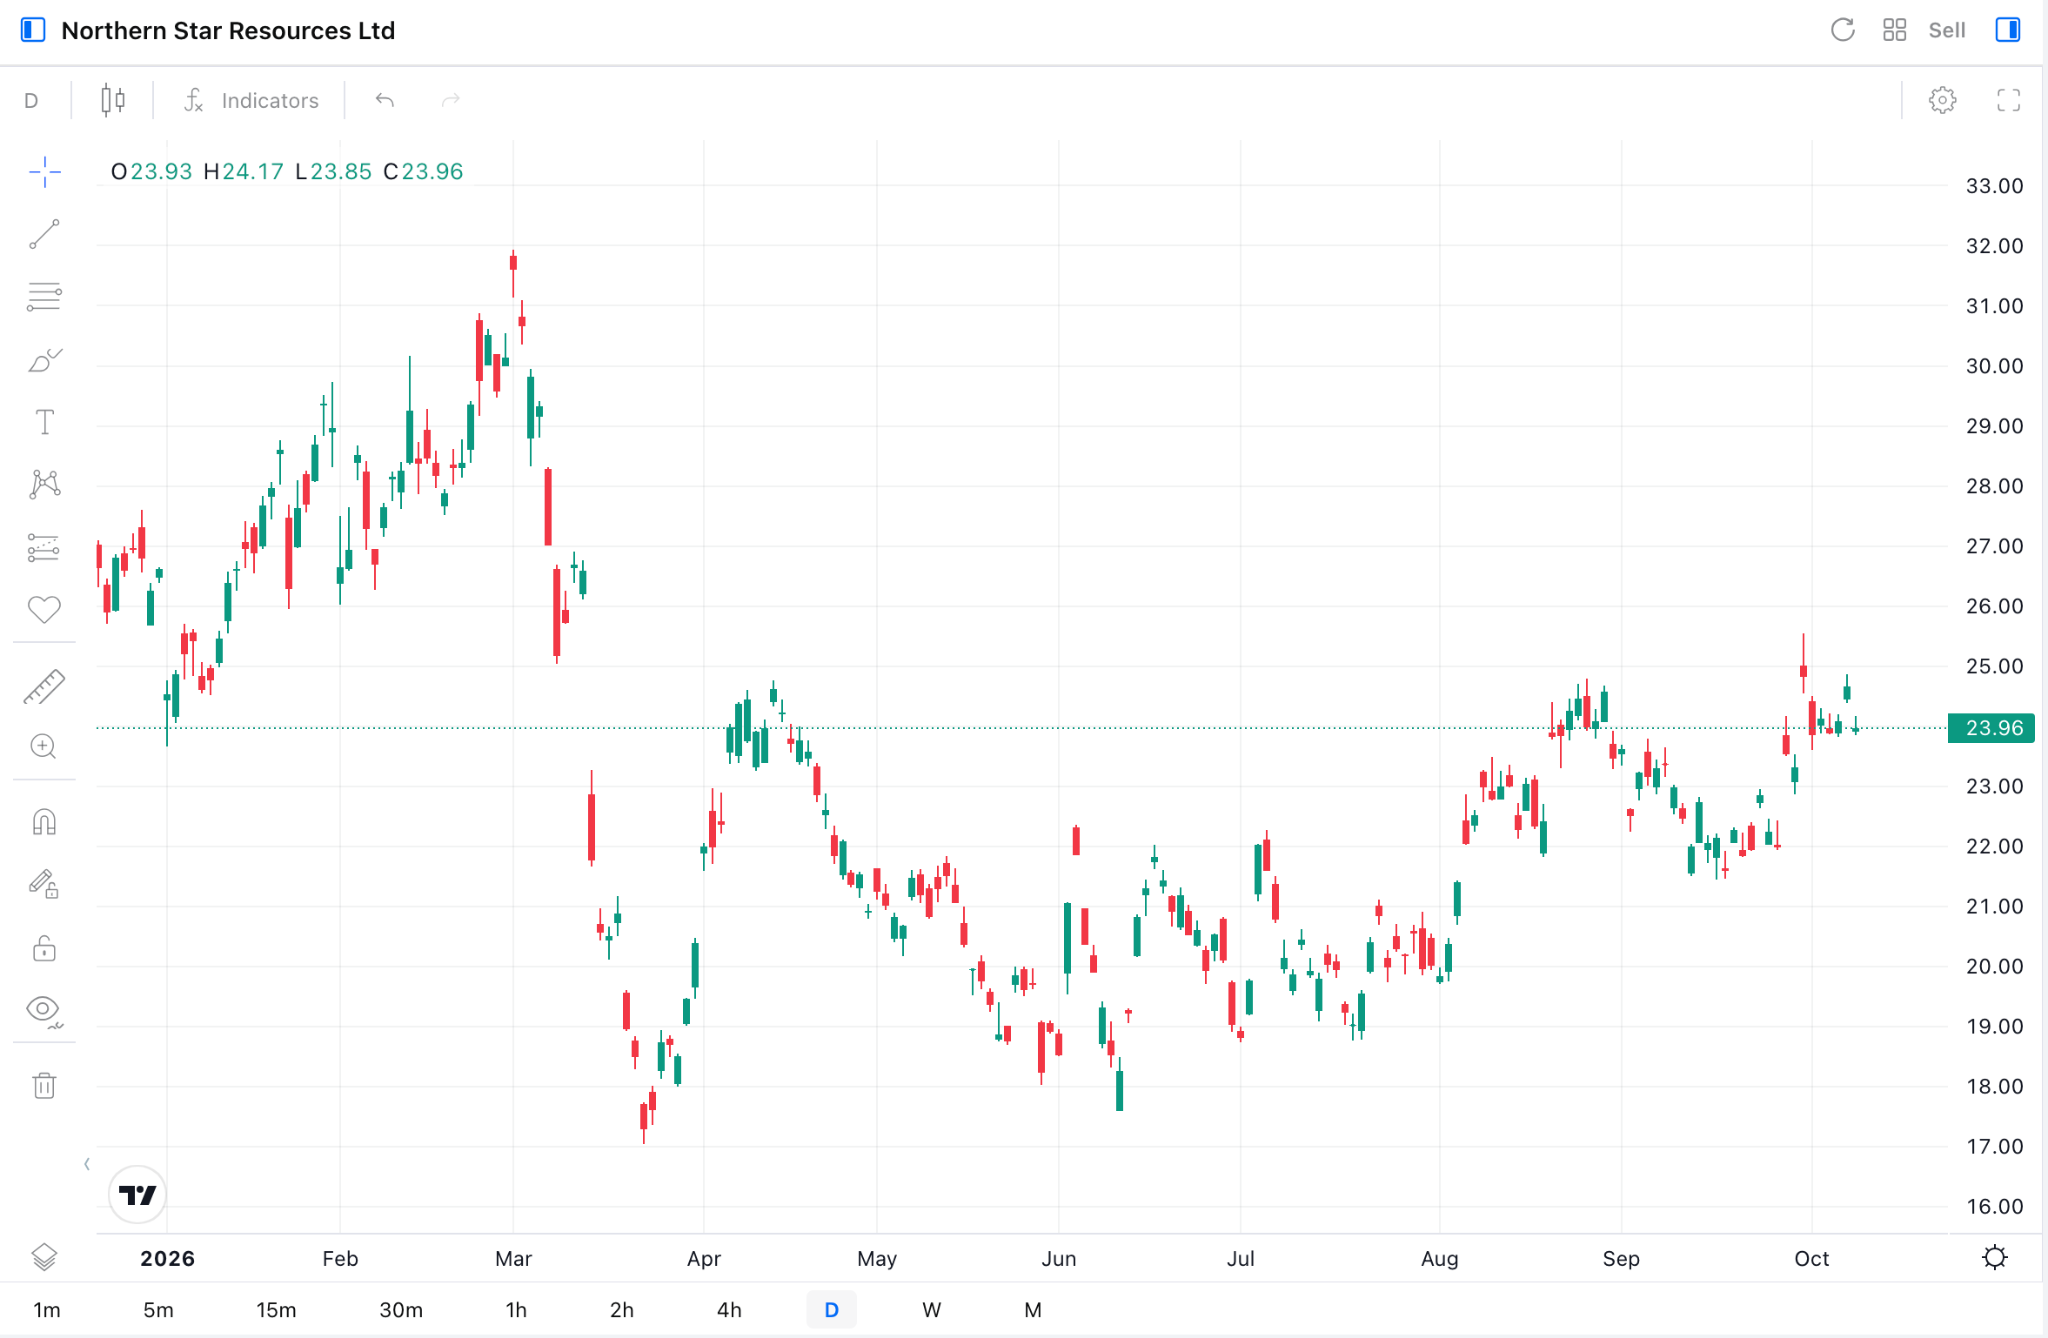
Image: Mitrade (NST.AU Daily Chart)
The chart shows Northern Star has held up well against gold. The stock is down just ~3% year to date, while gold is down about 6% over the same period.
Shares peaked in early March, plunged into late March, then recovered steadily through August. The stock now sits about 25% below its March high, which is close to gold's own fall from its record.
Northern Star releases its September quarter report on October 21. Traders will watch costs and KCGM progress closely.
“Trade NST Stock with an ASIC-regulated broker. Fast AUD funding via PayID. ”
Evolution Mining (EVN)
Evolution Mining (EVN) produces both gold and copper from mines in Australia and Canada. That copper exposure gives it a second source of revenue when gold weakens.
In FY26, Evolution produced 715,000 ounces of gold and 66,000 tonnes of copper. It delivered record group cash flow and finished the year in a net cash position.
The company also reported a record profit and lifted its dividend by 62%. Gold production fell slightly, so the result relied on higher prices rather than more ounces.
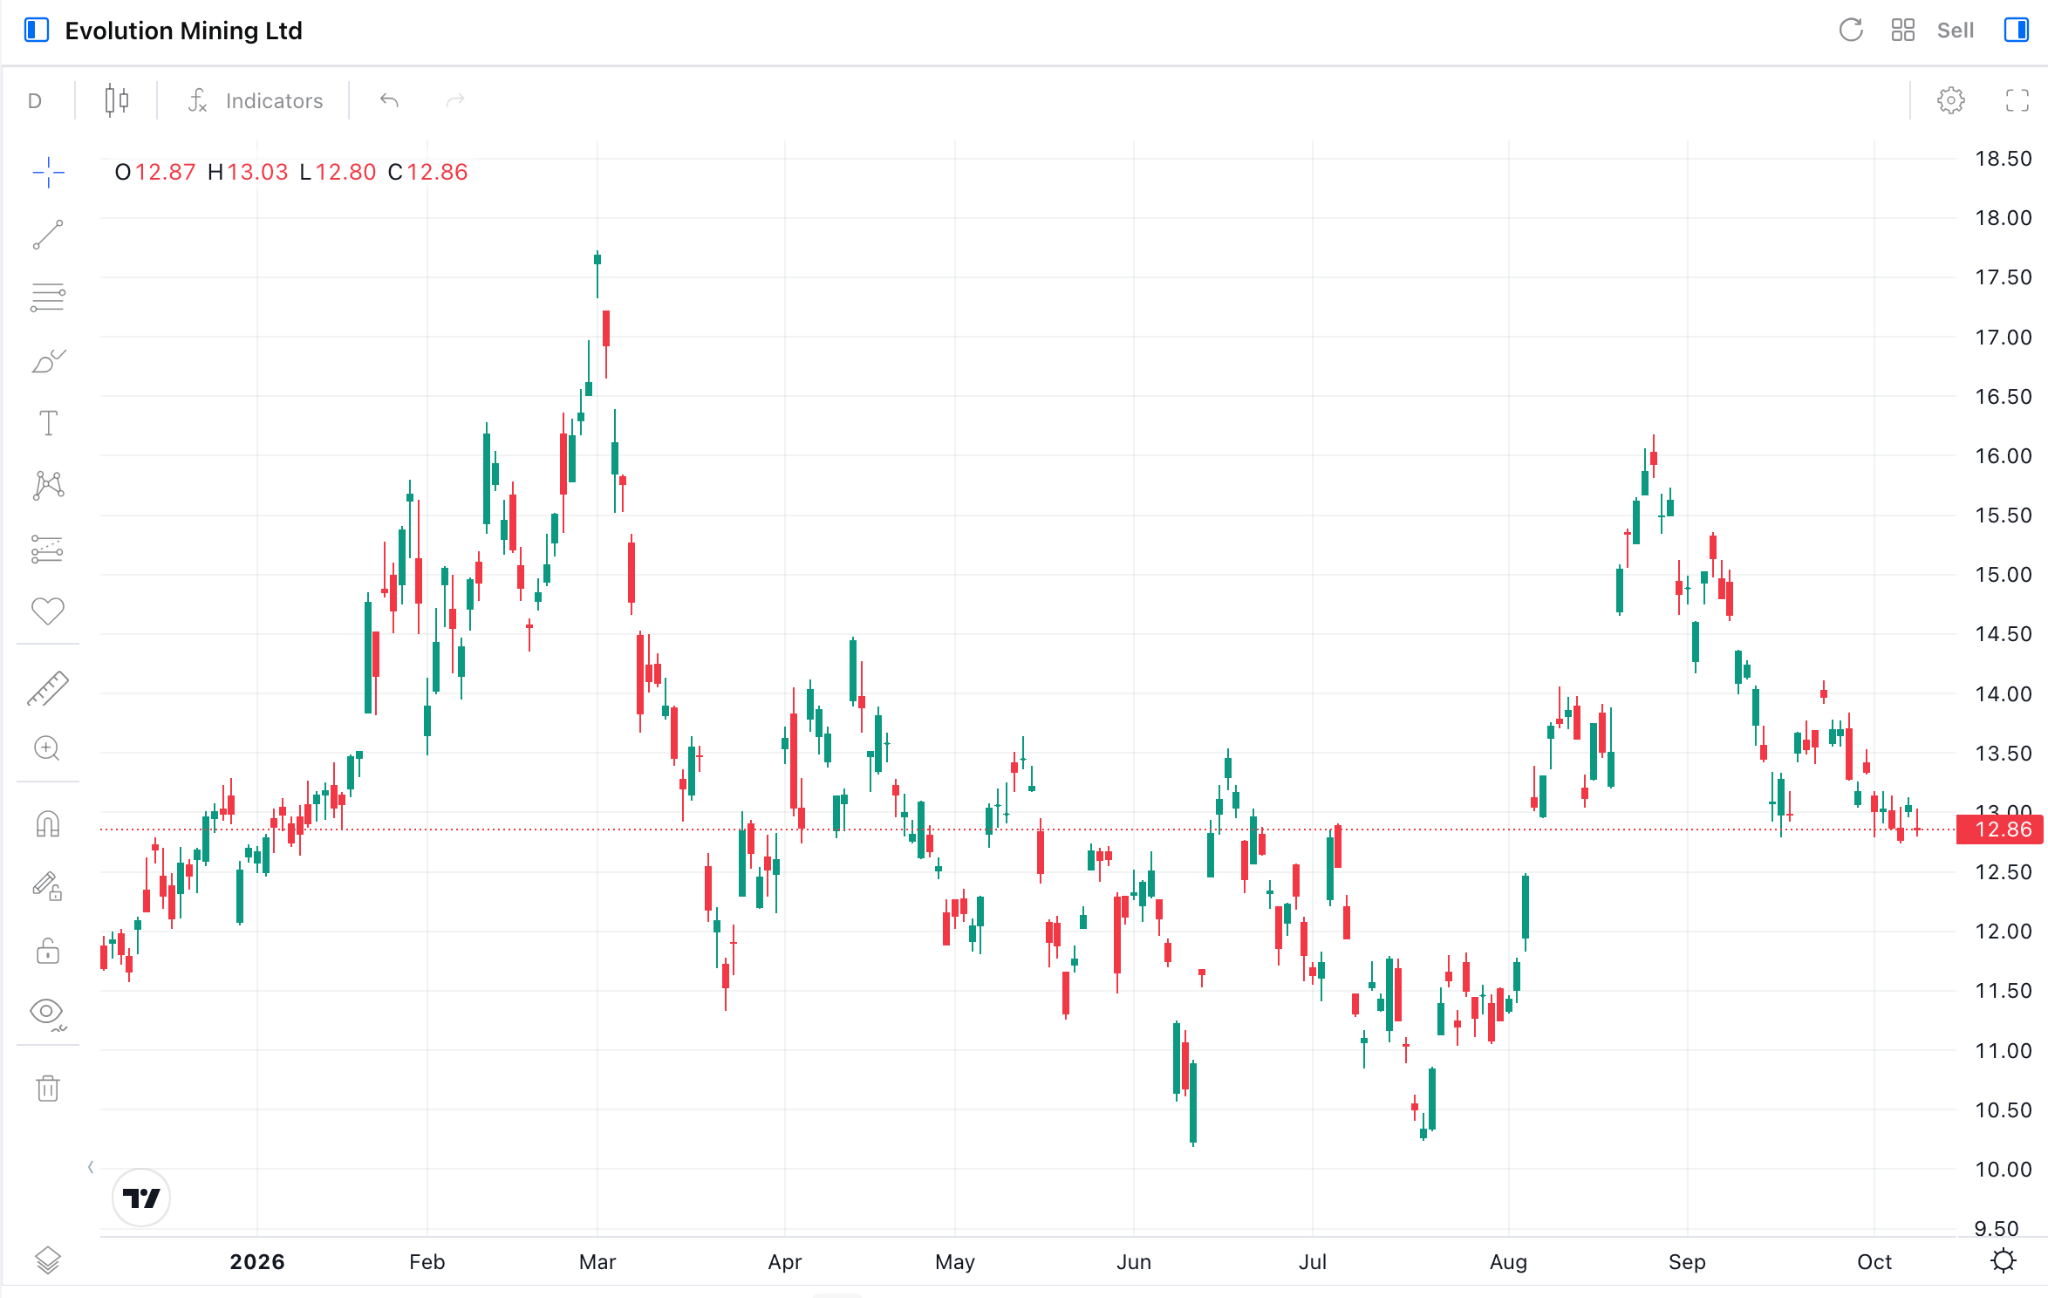
Image: Mitrade (EVN.AU Daily Chart)
Evolution's chart shows more volatility than Northern Star's. Shares peaked in early March, fell to lows in June and July, then rallied hard in August.
That rebound peaked in late August, and the stock has drifted lower since. It now trades about 27% below its March high, roughly in line with gold's fall from its peak.
Evolution reports its September quarter results on October 14. That is a week before Northern Star, so its numbers could set the tone for the sector.
“Trade EVN Stock with an ASIC-regulated broker. Fast AUD funding via PayID. ”
Newmont (NEM)
Newmont (NEM) is the world's largest gold miner, with major Australian assets including Boddington and Cadia. It is listed on the ASX, but Mitrade offers the US listed shares priced in US dollars.
Newmont's costs have climbed this year, but they remain competitive. Its AISC rose 58% to US$1,621 an ounce in Q2 2026, still below the industry average.
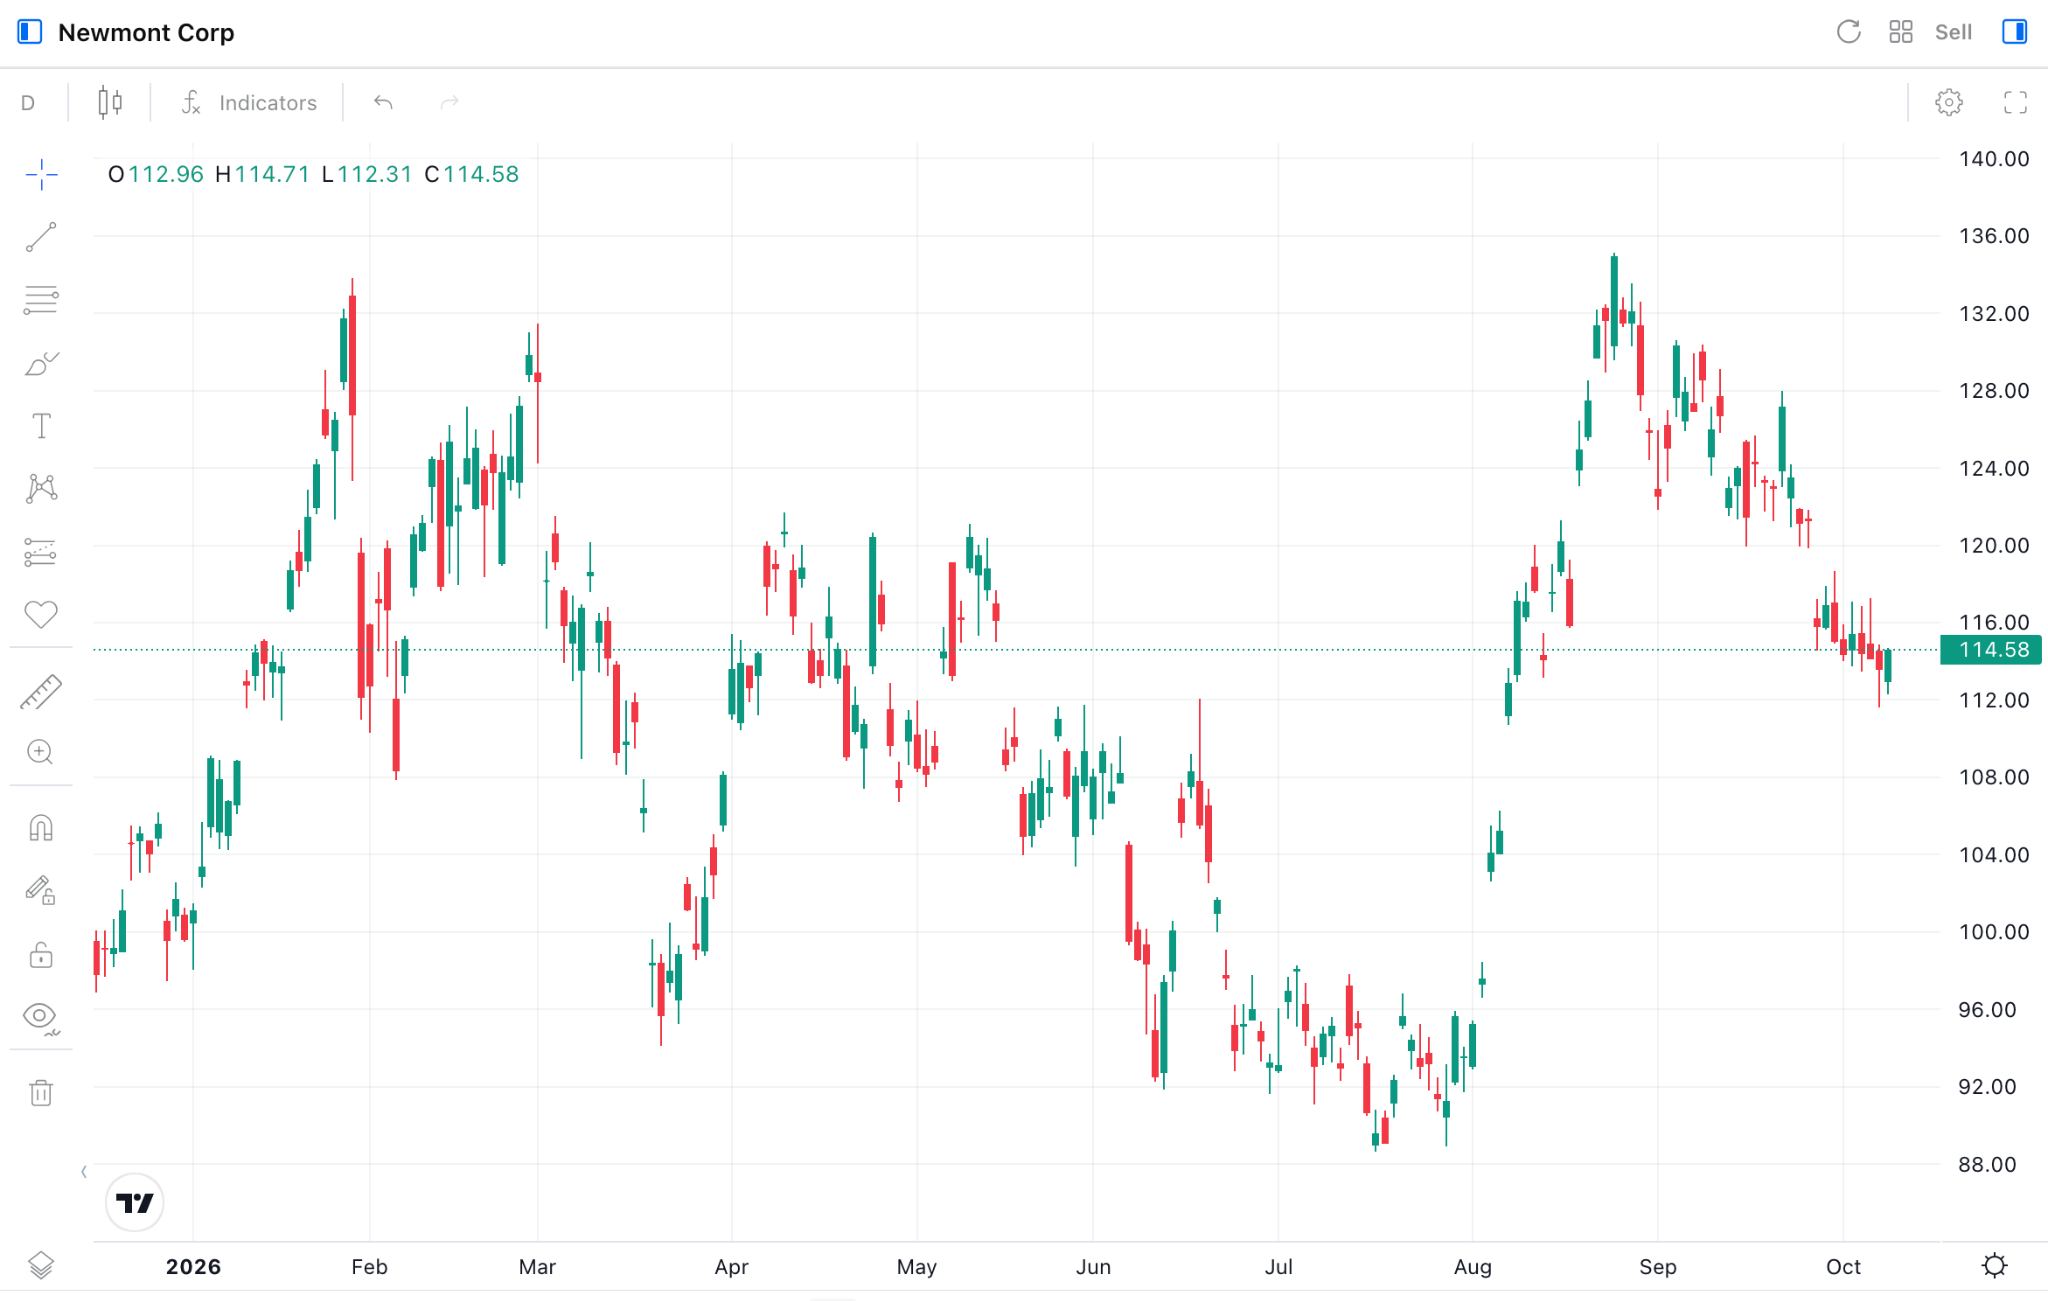
Image: Mitrade (Newmont NEM Daily Chart)
The chart shows Newmont took a different path from the ASX names. It peaked near its 52 week high of US$135.29 in late August, well after gold's January record.
The stock closed at US$113.54 on October 7, about 16% below that August peak. That is a much smaller fall than gold's 26% drop from its own record.
Newmont reports its third quarter results on October 22, one day after Northern Star. Its cost guidance will offer a global read on how miners are coping with lower prices.
“Trade NEM Stock with an ASIC-regulated broker. Fast AUD funding via PayID. ”
What Could Turn Gold Around
Gold's fall has been sharp, but some long term support remains in place. Central banks are still buying, led by China.
The People's Bank of China extended its buying streak to a 23rd month in September, adding 21 tonnes. That took its total gold reserves to 2,196 tonnes.
On the other side, systematic funds known as CTAs have been selling across the metals complex. That kind of trend following pressure can push prices lower than fundamentals alone would suggest.
The biggest swing factor is the Fed. If inflation cools and the December hike odds fade, gold could recover quickly, but a more aggressive Fed would keep the pressure on.
Geopolitics is the other wildcard. Tension in the Middle East has kept energy prices high this year, and any sudden escalation could revive safe haven demand for gold.
For gold stocks, a recovery in the metal would likely flow through quickly. Miners with wide margins already in place would see most of any price gain go straight to profit.
Key Dates for ASX Gold Stocks This Quarter
October brings a cluster of events that could move gold stocks sharply. Traders should mark these dates on their calendar.
October 14: Evolution Mining September quarter report.
October 21: Northern Star September quarter report.
October 22: Newmont third quarter results.
October 28: The Fed decision on US interest rates.
November 3: The RBA decision on Australian interest rates.
Quarterly reports matter most for individual miners. Production numbers, cost updates and any change to guidance often trigger large one day moves.
The central bank decisions matter for the whole sector. A Fed hike would add pressure on gold, while an RBA move could shift the AUD and change how local miners' margins look in Australian dollar terms.
How to Trade ASX Gold Stocks on Mitrade
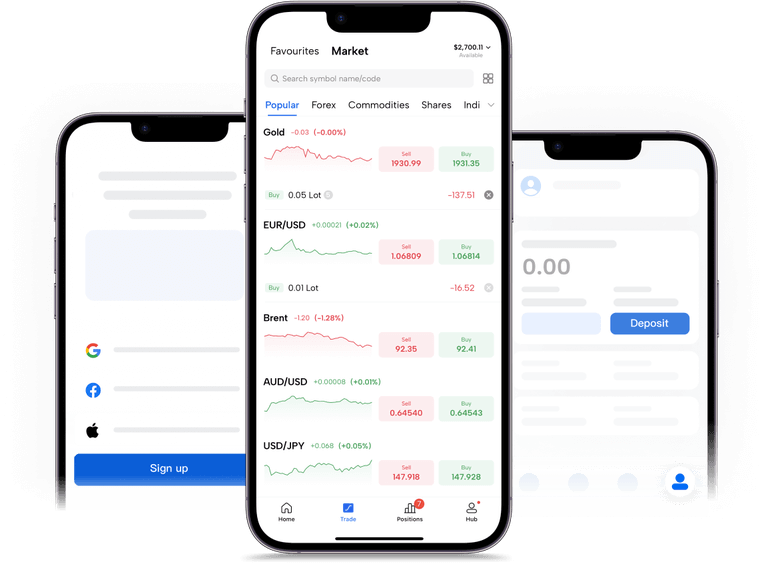
Mitrade offers CFDs on Northern Star, Evolution Mining and Newmont, as well as spot gold itself. Traders can go long if they expect a rebound, or short if they expect gold's slide to continue.
Some traders compare miners against the gold price to find relative strength. A miner rising while gold falls may signal strong company fundamentals, while a miner falling faster than gold may flag cost or project concerns.
Reporting days often bring sharp price gaps. Mitrade lets traders set a stop loss and take profit directly on the order screen, which helps manage risk around these events.
Under ASIC rules, leverage on share CFDs is capped at 5:1 and gold at 20:1. That still magnifies both gains and losses, so position sizing matters more than usual during a volatile quarter.
New traders can practise first on a free demo account loaded with virtual funds. That allows them to test strategies around the October reports before risking real money.


Other ASX Gold Stocks to Watch
Perseus Mining (PRU) runs gold mines in West Africa and reports its costs in US dollars. It produced 405,000 ounces in FY26 and guides 420,000 to 480,000 ounces for FY27.
Its FY27 cost guidance sits at US1,835toUS2,070 an ounce. Its Nyanzaga project in Tanzania is expected to pour first gold in January 2027.
Ramelius Resources (RMS) guides FY27 production of 205,000 to 225,000 ounces. Its four year plan targets 560,000 to 610,000 ounces a year by FY30.
That growth path requires heavy spending, which makes Ramelius more sensitive to a lower gold price. Traders should watch whether it keeps its spending plans intact.
Genesis Minerals (GMD) delivered record FY26 production of 285,402 ounces. It is also merging with Vault Minerals, with completion targeted for November 2026.
The combined group would produce roughly 600,000 to 700,000 ounces a year. That would make it one of the three largest gold producers in Australia.
You might be interested in…
1. Is gold in a bear market in 2026?
Yes. Gold has fallen about 26% from its January 28 record of US5,589toaroundUS4,125, which is beyond the 20% threshold that defines a bear market.
2. Why have ASX gold stocks fallen less than gold?
Most miners still earn wide margins even at today's prices. Industry costs average around US$1,785 an ounce, and a weaker Australian dollar helps protect local producers.
3. Which ASX gold stocks have the lowest costs?
Newmont reported AISC of US$1,621 an ounce in Q2 2026, still below the industry average despite a 58% rise. Upcoming September quarter reports will give updated cost figures for the other major producers.
4. When do ASX gold miners report their September quarter results?
Evolution Mining reports on October 14 and Northern Star on October 21. Newmont releases its third quarter results on October 22.
5. What could push the gold price higher again?
Steady central bank buying, led by China, continues to support gold. A softer path for US interest rates would likely be the biggest catalyst for a recovery.
6. Can I trade ASX gold stocks on Mitrade?
Yes. Mitrade is regulated by ASIC and offers CFDs on Northern Star, Evolution Mining, Newmont and spot gold with zero commission, plus a free demo account for practice.
Disclaimer: The content presented above, whether from a third party or not, is considered as general advice only. CFD trading involves significant risk of loss. Past performance does not guarantee future results. This article serves informational purposes only and does not constitute financial advice. Consider your risk tolerance before trading.


