


Silver Eyes Lower Prices as Daily Chart Confirms Bearish Setup


Silver (XAG/USD) price slipped to $73.42 on April 28, down 2.78%, as a descending triangle on the daily chart points toward a $68 downside target.
The setup follows a sharp rejection from the all-time high of $121.67 set on January 29. Falling volume and weakening momentum now reinforce the bearish bias across multiple timeframes.
Daily Chart Frames Silver Price Inside Descending Triangle
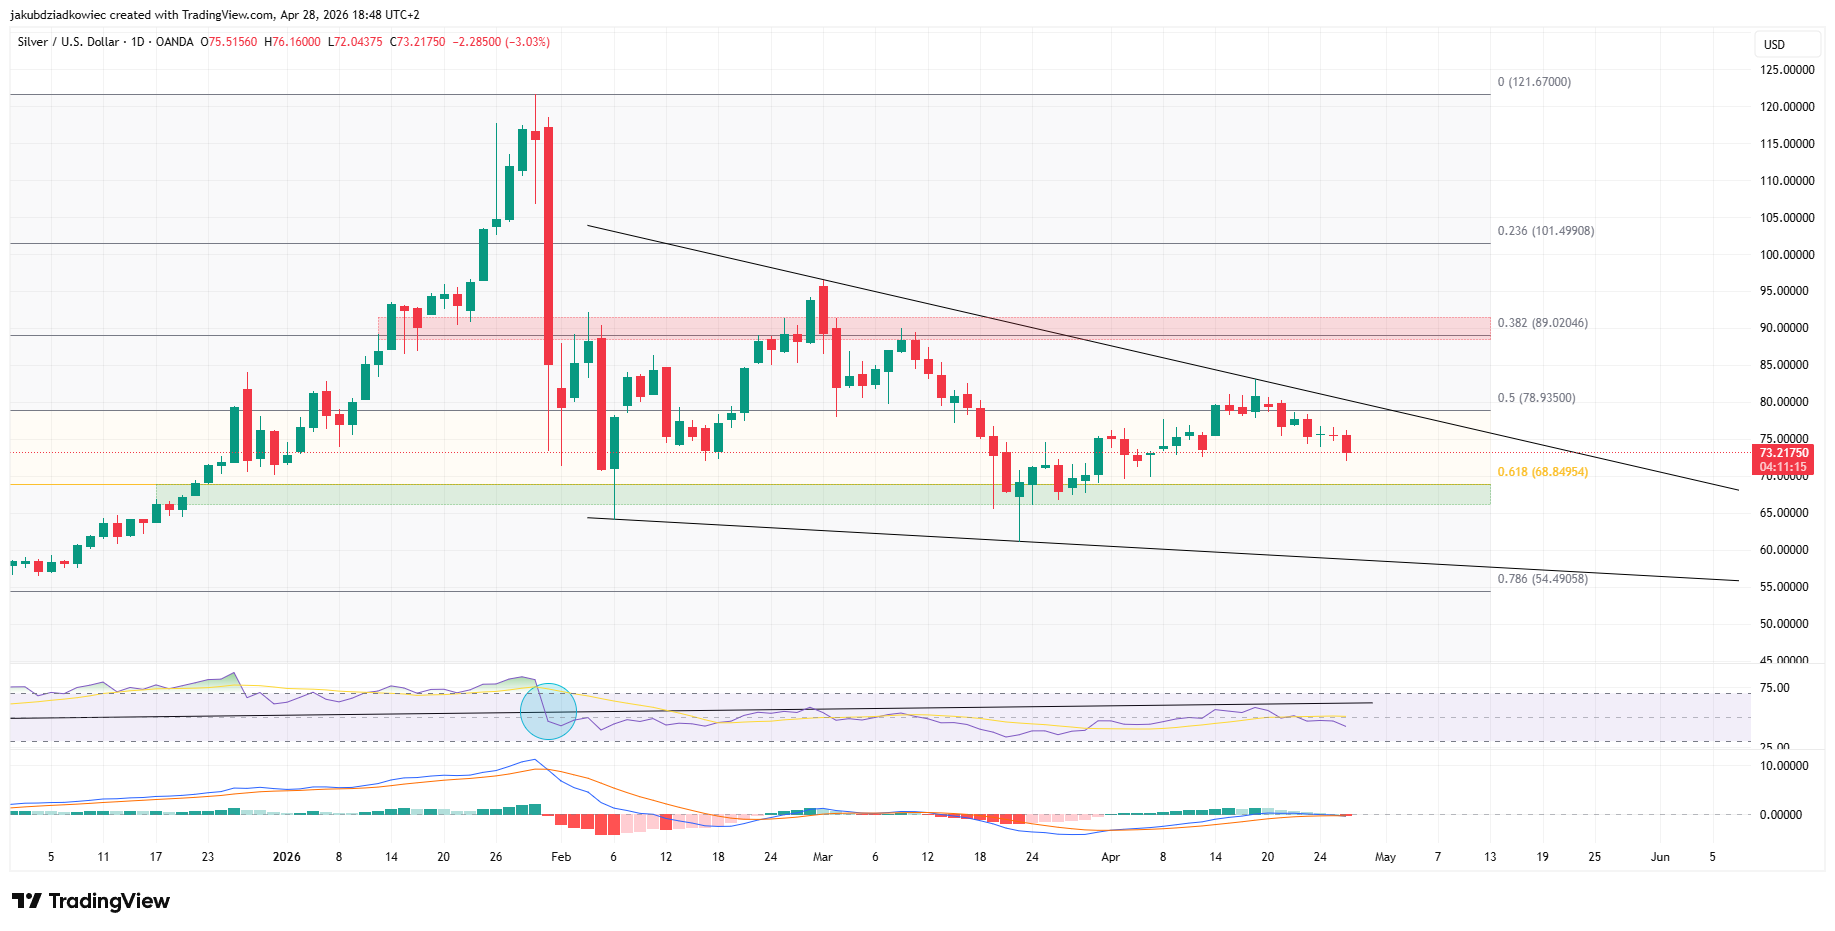
The daily chart shows silver locked inside a descending triangle that began forming after the January 29 peak. Price now sits near the upper boundary, suggesting another rejection toward the lower band.
Mapping the Fibonacci grid from the $121.67 high to the $54.49 low frames the trade clearly. Silver trades around $73.22, sitting between the 0.5 retracement at $78.93 and the 0.618 level at $68.85.
If the price closes below the upper band, the next bearish target sits at $68. That level aligns with the 0.618 retracement. A larger risk extends to $54.49 at the 0.786 level, which coincides with the triangle’s lower band.
Resistance sits at $89, capping rebounds at the 0.382 Fibonacci retracement. A close above that level would invalidate the bearish thesis. Such a move would reopen the path toward the $100 target watched earlier this year.
Volume tells a similar story to prior silver bearish signals from March. Two volume peaks lined up with the January and March 23 lows. The steady contraction since then points to an accumulation phase that often precedes a directional move.
MACD has recently crossed downward, keeping the bias tilted lower. RSI also broke its ascending trendline shortly after the all-time high, mirroring the price move.
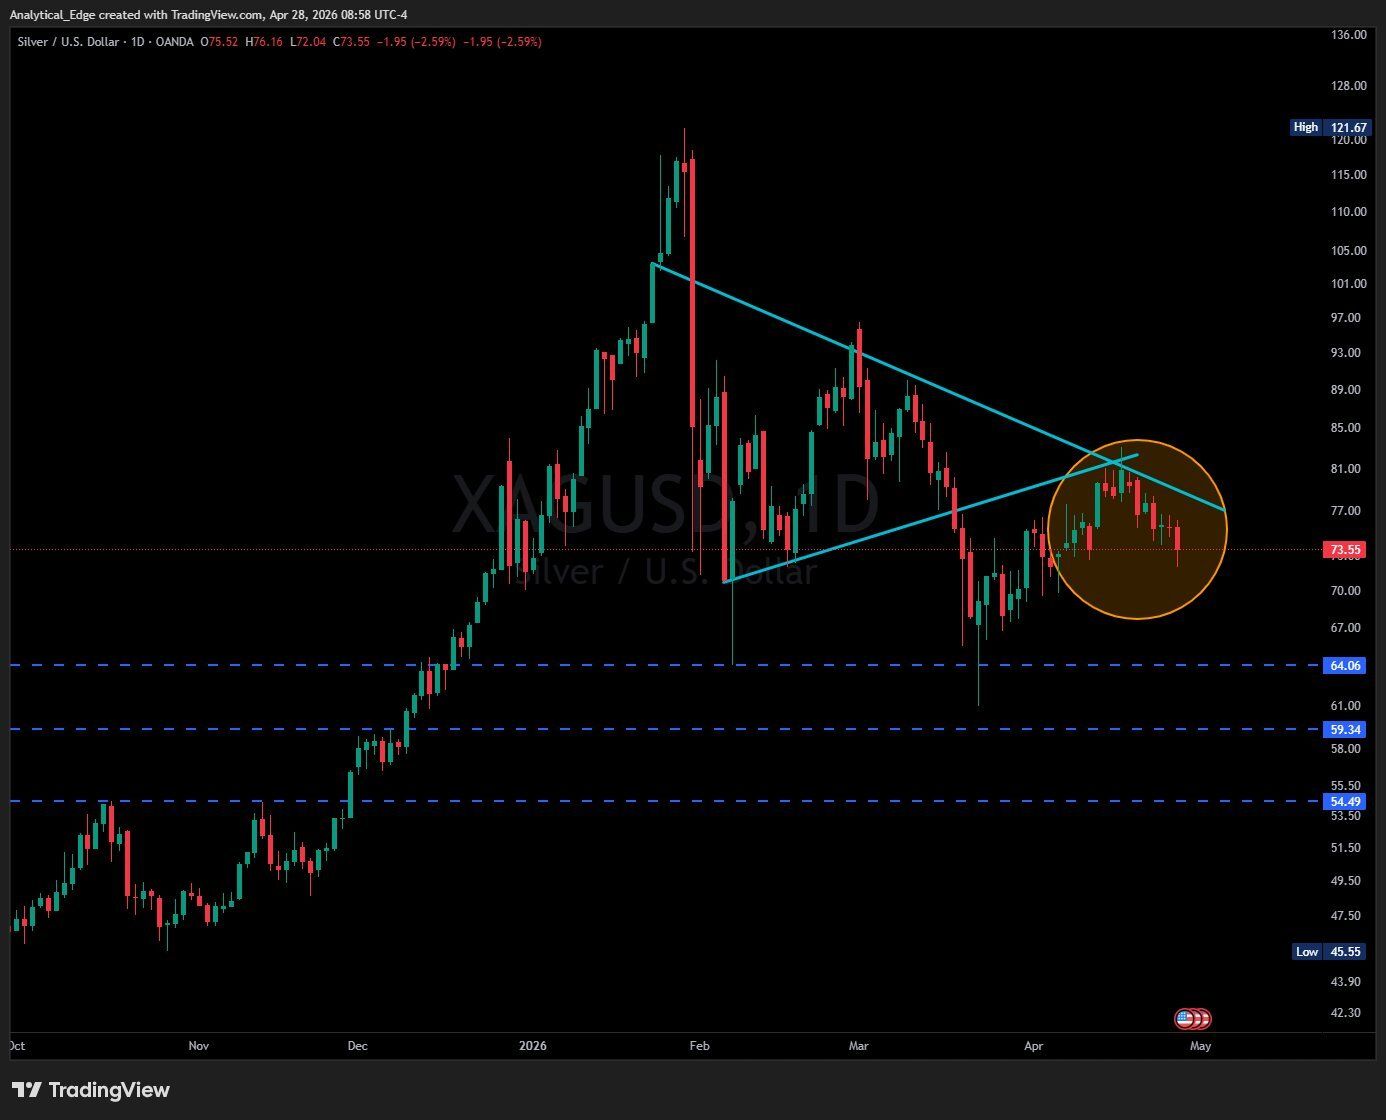
X user @EdgeStrategy67 flagged the same bearish structure on the daily timeframe. The post points to a bear flag formation that has continued to play out.
“As said for some time, bear flag formed and then it has continued in today. But it was expected according to chart!”
That independent read aligns with the descending triangle thesis and reinforces the case for further downside.
Four-Hour Chart Sets $68 as Silver Price Target
The four-hour chart confirms the bearish picture but adds a short-term wrinkle. Price broke down from an ascending parallel channel on April 23 after rejecting the $82 high printed on April 17.
That April 17 rally high lined up with the upper band of the daily descending triangle. The cluster of resistance triggered a swift reversal, pushing silver back below $74.
RSI on the four-hour timeframe has slipped to 32, approaching oversold territory. That reading hints at a possible short-term bounce before any deeper leg develops. MACD leans slightly bearish, keeping the broader structure intact.
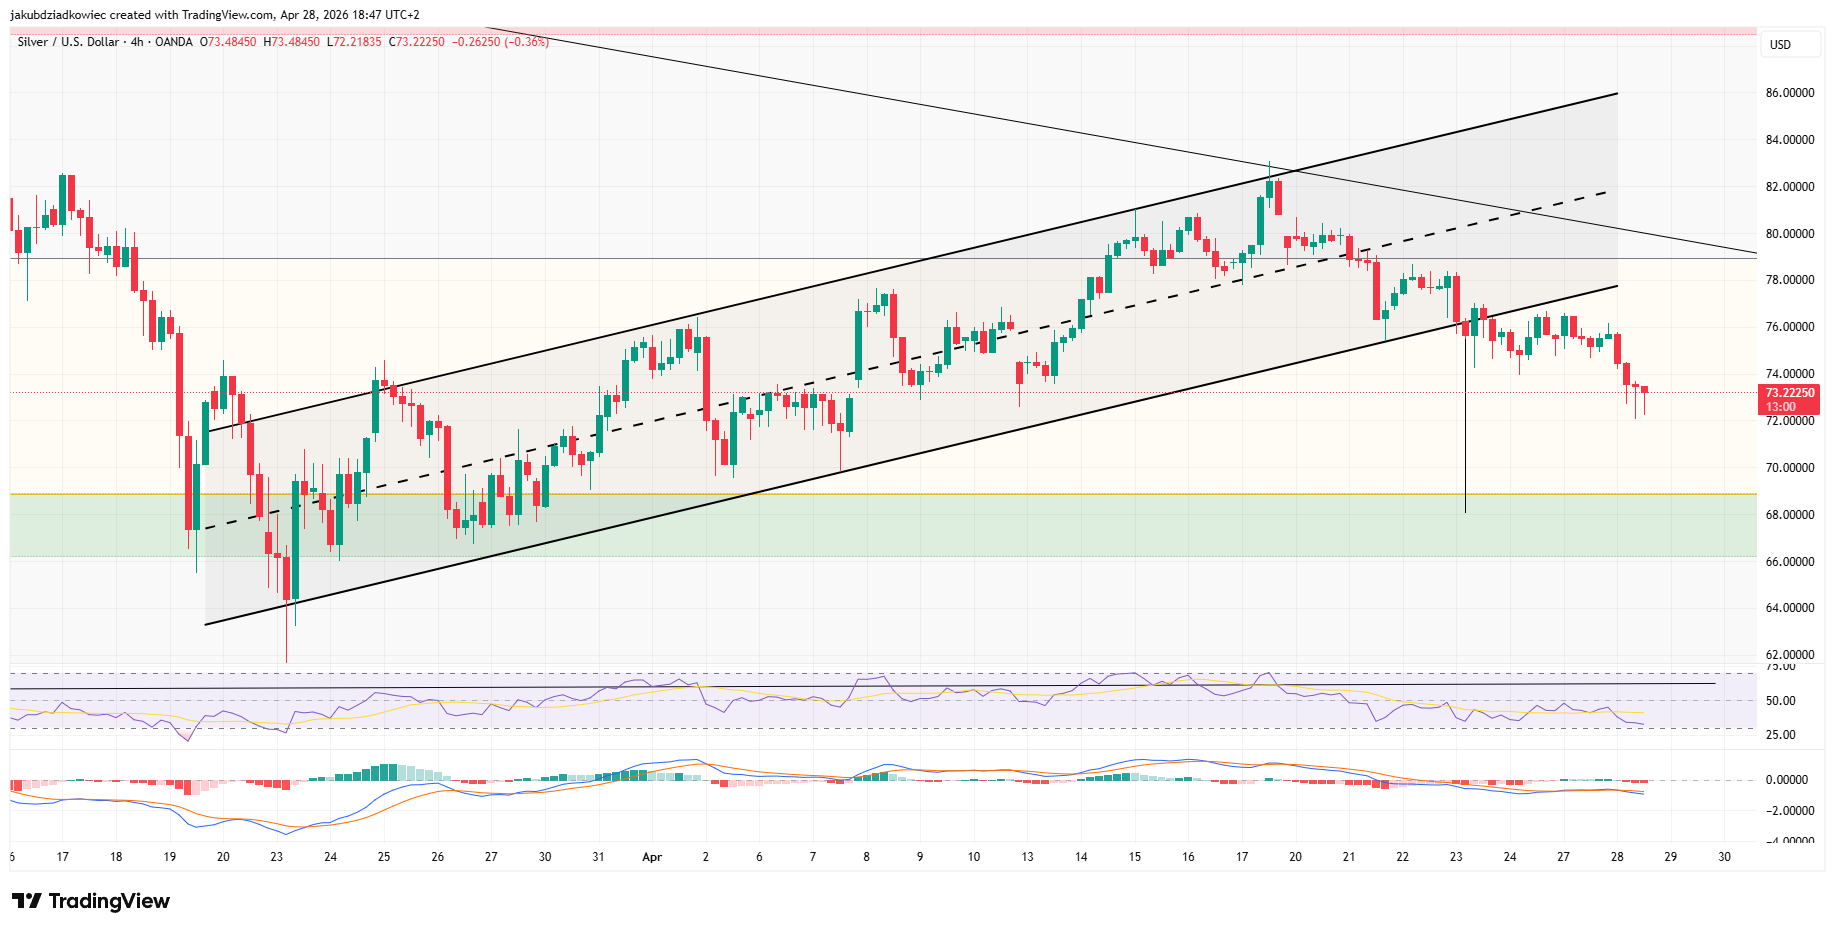
The measured move from the channel height projects toward $68. That level capped buyers in late March and aligns with the 0.618 Fibonacci retracement on the daily chart.
The fundamental backdrop reinforces the chart picture. Silver pulled back as US-Iran tensions drove oil-led inflation expectations higher. The shift has lifted the US Dollar and weighed on non-yielding metals.
The next few sessions will decide whether silver retests the $68 low directly. A relief bounce off oversold readings could arrive first before the larger move resolves.
 Don't Miss Today's Market Moves Start trading Forex, Gold & Crypto today Regulated platform | Fast withdrawals
* The content presented above, whether from a third party or not, is considered as general advice only. This article should not be construed as containing investment advice, investment recommendations, an offer of or solicitation for any transactions in financial instruments.


