


Prediction: This International ETF Will Beat U.S. Stocks for the Next 5 Years
Key Points
A study from Vanguard sees international developed-market stocks outperforming for the next 10 years.
Vanguard's International High Dividend Yield ETF has bested its S&P 500 ETF in the past five years.
Despite its strong gains, this international value stock ETF might still be undervalued based on P/E ratios.
- 10 stocks we like better than Vanguard International High Dividend Yield ETF ›
Buying international stocks hasn't always been a top priority for American investors. Some believe that Americans don't need to own international stocks because U.S. companies make so much of their revenue from foreign markets. And for most of the past 10-15 years, America's tech-heavy stock market has strongly outperformed the rest of the world.
But all of this could be changing. More American investors are looking for opportunities to buy stocks in markets beyond the U.S. The biggest winners of the next 10 years might not look anything like the tech-heavy portfolios of U.S. large-cap growth stocks that delivered big returns for the past decade.
Missed Nvidia in 2009? This Rare Signal Is Flashing Again. In 2009, a "Double Down" signal flashed for a little-known chipmaker called Nvidia. For the first time in years, that same "Total Conviction" signal is flashing for a company 1/100th the size of Nvidia. Continue »
Let's take a closer look at a Vanguard international ETF that could help you tap into this trend -- and see if it could be a good choice for the next five years or longer.

Image source: Getty Images.
Vanguard research says: International stocks could beat U.S. stocks for 10 years
According to Vanguard research, international stocks in developed markets are expected to deliver higher returns than U.S. stocks, including U.S. large-cap and U.S. growth stocks, for the next 10 years. One way to invest in that theme would be to buy the Vanguard International High Dividend Yield ETF (NASDAQ: VYMI), which predominantly holds stocks from developed markets like Canada, Japan, and Western Europe.
Many American investors might be surprised to learn this, but it's true: the Vanguard International High Dividend Yield ETF has outperformed the S&P 500 index and the Vanguard S&P 500 ETF (NYSEMKT: VOO) for the past five years.
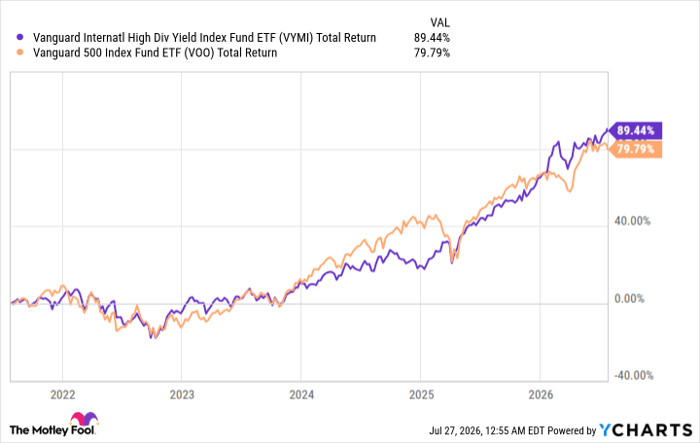
VYMI Total Return Level data by YCharts
The Vanguard International High Dividend Yield ETF holds a lot of companies that are far removed from the artificial intelligence (AI) trade. Instead of a tech-heavy portfolio, this fund offers steadily profitable value stocks with a heavier weighting in industries such as pharmaceuticals, financials, and energy.
Vanguard International High Dividend Yield ETF (VYMI): 1,565 stocks, 10 years of 10.8% annualized returns
The Vanguard International High Dividend Yield ETF holds a portfolio of 1,565 stocks from 45 countries. Forty-four percent of the fund's portfolio is invested in European stocks, with another 23.7% in Pacific stocks, 22.4% in emerging markets, 9.2% in North America, and 0.70% in the Middle East.
The top five countries represented in this high-yield dividend ETF are Japan, the United Kingdom, Canada, Switzerland, and Australia. The top 10 stock holdings include:
- British multinational bank HSBC Holdings (1.76% of the fund)
- Swiss pharmaceutical majors Novartis (1.58%) and Roche Holding AG (1.57%)
- Japanese bank Mitsubishi UFJ Financial Group (1.17%)
- Canadian banks Royal Bank of Canada (1.57%) and Toronto-Dominion Bank (1.1%)
- Australian mining stock BHP Group (1.15%)
The Vanguard International High Dividend Yield ETF has been paying exceptionally strong dividends. Its trailing 12-month dividend yield is 3.68%, which is better than most of the best dividend index funds. And this fund might still be underpriced: Its price-to-earnings (P/E) ratio is 14.7, which is about a 42% discount compared to the earnings multiple of 25.2 for the S&P 500.
This international ETF might have flown under many American investors' radars. But it's delivered strong annualized returns of 12.7% over the past five years, 21.1% over the past three years, and 27.5% over the past year.
Should you buy VYMI or VOO?
The Vanguard International High Dividend Yield ETF doesn't always beat U.S. stocks. In the past 10 years, it's delivered annualized returns (by net asset value) of about 10.8%, which has underperformed the Vanguard S&P 500 ETF's 10-year annualized returns of about 15.5%.
If you want to prioritize U.S. large-cap stocks in your portfolio, the Vanguard S&P 500 ETF is a popular, ultra-low-cost way to do that (its expense ratio is only 0.03%). VOO holds 506 stocks, with a strong technology weighting. The tech sector makes up 38% of its portfolio, with financials (11.8%), communication services (9.7%), consumer discretionary (9.3%), and healthcare (8.9%) in distant second through fifth place.
There's no guarantee that any country, industry, or company will beat the rest of the global stock market for long. If you believe that America's largest companies are going to keep growing strong, buying the Vanguard S&P 500 ETF could be a solid choice. This U.S. ETF is popular for a reason. It holds $1.7 trillion of net assets and is a foundational building block of many investors' portfolios.
But if you are worried that U.S. tech stock valuations have gotten too high, and want to diversify your portfolio across different industries and global markets/companies, the Vanguard International High Dividend Yield ETF might be a good choice. This international ETF invests in value stocks that pay strong, steady dividends. It might be a good hedge against volatility in the U.S. tech-driven economy and could deliver valuable peace of mind for the next five years or longer.
Should you buy stock in Vanguard International High Dividend Yield ETF right now?
Before you buy stock in Vanguard International High Dividend Yield ETF, consider this:
The Motley Fool Stock Advisor analyst team just identified what they believe are the 10 best stocks for investors to buy now… and Vanguard International High Dividend Yield ETF wasn’t one of them. The 10 stocks that made the cut could produce monster returns in the coming years.
Consider when Netflix made this list on December 17, 2004... if you invested $1,000 at the time of our recommendation, you’d have $379,662!* Or when Nvidia made this list on April 15, 2005... if you invested $1,000 at the time of our recommendation, you’d have $1,206,116!*
Now, it’s worth noting Stock Advisor’s total average return is 886% — a market-crushing outperformance compared to 206% for the S&P 500. Don't miss the latest top 10 list, available with Stock Advisor, and join an investing community built by individual investors for individual investors.
See the 10 stocks »
*Stock Advisor returns as of July 29, 2026.
HSBC Holdings is an advertising partner of Motley Fool Money. Ben Gran has no position in any of the stocks mentioned. The Motley Fool has positions in and recommends Vanguard S&P 500 ETF. The Motley Fool recommends BHP Group, HSBC Holdings, and Roche Holding AG. The Motley Fool has a disclosure policy.
Recommended Articles


