


If I Could Tell Every Investor 1 Thing About the Next Bear Market, It's This
Key Points
The market has been volatile lately, and some metrics are suggesting more turbulence could be on the way.
No matter when the next bear market begins, now is the time to prepare.
Protecting your portfolio against a downturn is simpler than you might think.
- 10 stocks we like better than S&P 500 Index ›
After years of record-breaking growth, major market indexes are stagnating. The S&P 500 (SNPINDEX: ^GSPC) is down 0.42% over the past month, as of this writing, while the tech-focused Nasdaq Composite (NASDAQINDEX: ^IXIC) has sunk by nearly 2% in that time.
Some market indicators are also raising red flags over valuations. The S&P 500 Shiller CAPE Ratio, for instance, is the highest it's been since the dot-com bubble, suggesting the index is trading at a premium. The Buffett indicator is also at a record high of 236%. For context, Warren Buffett himself noted that when this indicator nears 200%, investors are "playing with fire."
Where to invest $1,000 right now? Our analyst team just revealed what they believe are the 10 best stocks to buy right now, when you join Stock Advisor. See the stocks »
Now, this doesn't mean that a bear market is around the corner. But downturns are a normal part of the market's cycle, so it's not a matter of if we face a pullback, but when. Here's my number one piece of advice about how to prepare right now.

Image source: Getty Images.
The market's future is bright
Volatility could be looming, but a century's worth of history proves one thing: The investors who win out are those who stay invested for the long haul.
Since 1919, every single one of the S&P 500's 20-year periods ended in positive total returns, according to analysis from Crestmont Research. This means that if you'd invested in an S&P 500 index fund or ETF at any point and held it for 20 years, you'd have made money.
This trend holds up even during particularly shaky periods. During the bear market following the dot-com bubble, for example, the S&P 500 and Nasdaq plunged by nearly 50% and 80%, respectively. By the time the market finally recovered, it almost immediately sank into the Great Recession.
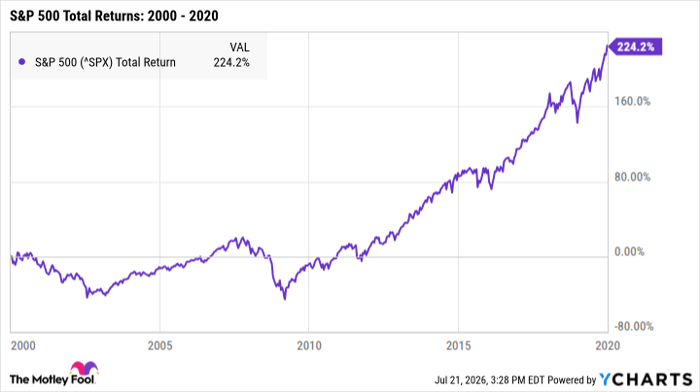
^SPX data by YCharts
Those back-to-back bear markets were historically unprecedented. Yet between January 2000 and January 2020, the S&P 500 earned total returns of more than 224%.
In other words, even if you'd invested in the S&P 500 at the seemingly worst moment -- immediately before the dot-com bubble burst in early 2000 -- you'd still have more than tripled your money over the following two decades.
The key to building long-term wealth
Staying invested in the market for the long haul is perhaps the most effective way to protect your portfolio, but it's also critical to invest in quality stocks and funds that are likely to recover from volatility.
With enough hype, even shaky stocks may thrive in the short term. However, without strong business foundations -- such as healthy finances, a viable business model, and growth potential within the industry -- they're most likely to struggle during the next bear market.
Nobody can say exactly when the next bear market will begin, but it's wise to prepare for it now to be safe. With a portfolio full of strong stocks and a long-term outlook, you can set yourself up for substantial growth over time.
Should you buy stock in S&P 500 Index right now?
Before you buy stock in S&P 500 Index, consider this:
The Motley Fool Stock Advisor analyst team just identified what they believe are the 10 best stocks for investors to buy now… and S&P 500 Index wasn’t one of them. The 10 stocks that made the cut could produce monster returns in the coming years.
Consider when Netflix made this list on December 17, 2004... if you invested $1,000 at the time of our recommendation, you’d have $377,990!* Or when Nvidia made this list on April 15, 2005... if you invested $1,000 at the time of our recommendation, you’d have $1,269,518!*
Now, it’s worth noting Stock Advisor’s total average return is 896% — a market-crushing outperformance compared to 206% for the S&P 500. Don't miss the latest top 10 list, available with Stock Advisor, and join an investing community built by individual investors for individual investors.
See the 10 stocks »
*Stock Advisor returns as of July 27, 2026.
Katie Brockman has no position in any of the stocks mentioned. The Motley Fool has no position in any of the stocks mentioned. The Motley Fool has a disclosure policy.
Recommended Articles


