


EUR/USD Price Forecast: Resumes decline after testing Bearish Flag breakdown
- EUR/USD falls back from the intraday high of 1.1418 as the US Dollar rebounds.
- The Fed is expected to leave interest rates unchanged.
- ECB officials warn that inflation could remain above the 2% target for a longer period.
The Euro (EUR) gives back a majority of its early gains against the US Dollar (USD) after failing to rise above the intraday high of 1.1418 on Monday. During European trade, the US Dollar Index (DXY), which gauges the Greenback’s value against six major currencies, trades almost 0.2% higher to near 1.1395.
The major currency pair surrenders early gains as the US Dollar (USD) bounces back after a weak start of the week. The US Dollar started lower as the pause in military aggression between the United States (US) and Iran over the weekend diminished the appeal of safe-haven assets.
This week, major triggers for the pair will be the Federal Reserve’s (Fed) monetary policy announcement on Wednesday, and the release of the Eurozone Harmonized Index of Consumer Prices (HICP) data for July on Friday.
Investors expect the Fed to leave interest rates unchanged in the range of 3.50%-3.75% again and deliver no monetary policy guidance, while warning of upside inflation risks.
On the Eurozone front, the inflation data will influence the European Central Bank‘s (ECB) interest rate expectations, as officials have expressed concerns regarding prolonged elevated inflationary pressures.
EUR/USD technical analysis
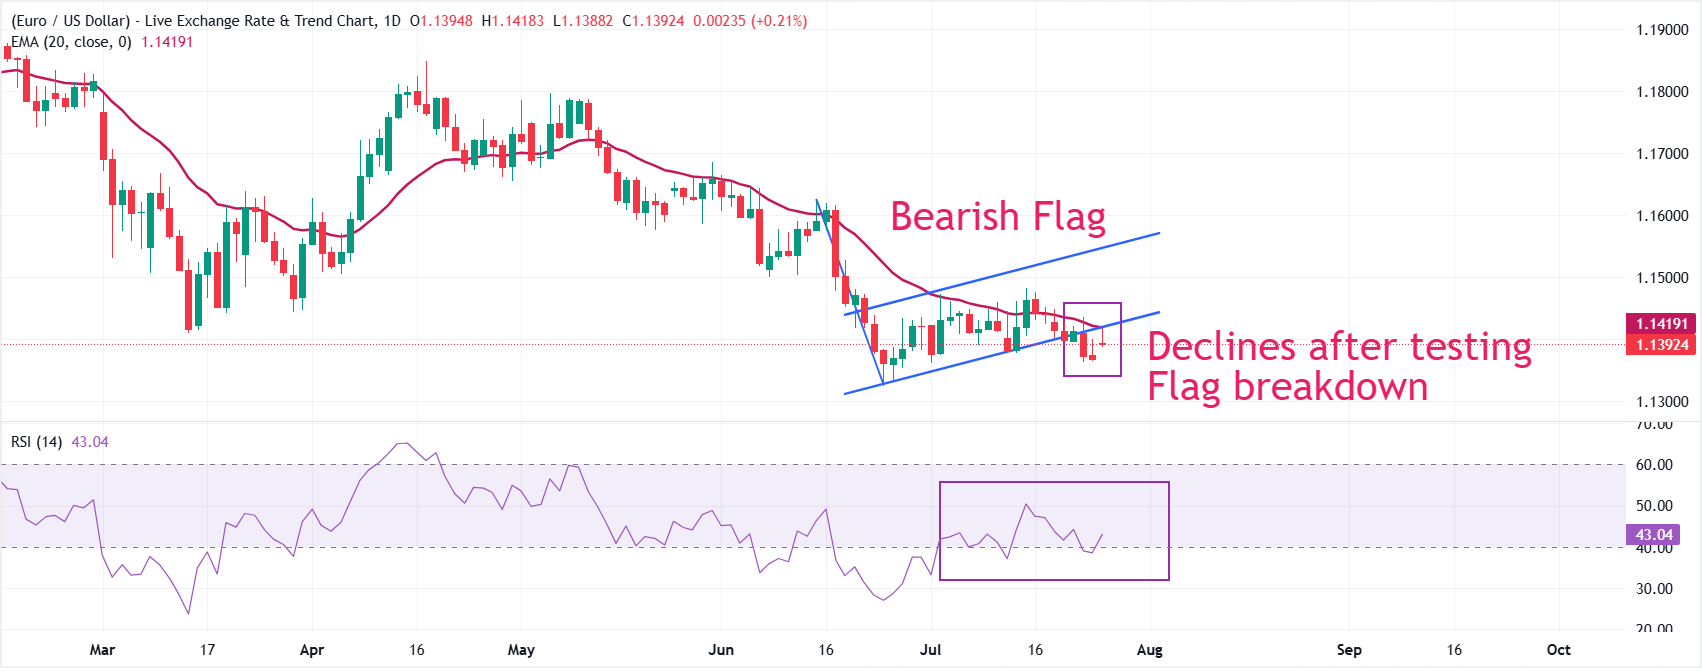
EUR/USD trades higher at around 1.1392, but is keeping a mildly bearish near-term tone as the 20-day Exponential Moving Average (EMA) at around 1.1419 continues to act as a key barrier. The pair has also faced rejection near the breakdown region of the 20-day EMA, which is around 1.1420.
The Relative Strength Index (RSI) around 43 suggests subdued bearish momentum rather than outright oversold conditions.
On the topside, initial resistance is located at the former channel floor turned barrier near 1.1420, with the upper channel boundary around 1.1550 acting as the next key cap if buyers regain traction. On the downside, immediate support is the prior trend-line reaction levels around 1.1381, with a deeper slide exposing structural support near 1.1312.
(The technical analysis of this story was written with the help of an AI tool. Know more.)
Economic Indicator
Fed Interest Rate Decision
The Federal Reserve (Fed) deliberates on monetary policy and makes a decision on interest rates at eight pre-scheduled meetings per year. It has two mandates: to keep inflation at 2%, and to maintain full employment. Its main tool for achieving this is by setting interest rates – both at which it lends to banks and banks lend to each other. If it decides to hike rates, the US Dollar (USD) tends to strengthen as it attracts more foreign capital inflows. If it cuts rates, it tends to weaken the USD as capital drains out to countries offering higher returns. If rates are left unchanged, attention turns to the tone of the Federal Open Market Committee (FOMC) statement, and whether it is hawkish (expectant of higher future interest rates), or dovish (expectant of lower future rates).
Read more.Next release: Wed Jul 29, 2026 18:00
Frequency: Irregular
Consensus: 3.75%
Previous: 3.75%
Source: Federal Reserve
Recommended Articles


