


Gold firms as Oil prices fall on temporary US-Iran pause
- Gold opens the week higher as a temporary US-Iran pause fuels a sharp drop in Oil prices.
- Traders await the Fed’s interest-rate decision on Wednesday and US PCE inflation data on Thursday.
- XAU/USD stays range-bound between $4,000 and $4,200, hovering near the 21-day SMA.
Gold (XAU/USD) opens the week with a bullish gap on Monday as a temporary pause in attacks between the United States (US) and Iran improves risk sentiment and sends Oil prices sharply lower. At the time of writing, XAU/USD is trading around $4,102, up 1.24% on the day.
US Ambassador to the United Nations Mike Waltz said President Donald Trump is giving negotiations some space while keeping all military options on the table. Tehran also said it would refrain from fresh attacks as long as Washington did the same.
Still, buyers appear reluctant to chase Gold higher as the geopolitical situation remains fluid. Iranian Foreign Ministry spokesperson Esmaeil Baghaei said the situation in the Strait of Hormuz had not changed and that the strategic waterway remained closed.
West Texas Intermediate (WTI) trades near $82.50 per barrel, down more than 7% on the day. Gold’s reaction again shows how the metal has decoupled from its traditional safe-haven role since the US-Iran war began.
Positive developments lift Gold by pushing Oil prices lower, easing inflation concerns and reducing hawkish Federal Reserve (Fed) bets. In contrast, renewed fighting tends to drive energy prices and interest-rate expectations higher, weighing on the precious metal.
The Fed’s interest-rate decision on Wednesday is the key risk event this week, alongside the US Personal Consumption Expenditures (PCE) inflation data on Thursday.
The central bank is expected to leave rates unchanged, but traders still price in a 33% chance of a hike, according to the CME FedWatch Tool. The probability of a rate increase in September stands near 79%.
The possibility of higher US interest rates remains a major headwind for the non-yielding metal, while the US Dollar continues to benefit from hawkish Fed expectations and the evolving geopolitical situation.
The US Dollar Index (DXY), which tracks the Greenback's value against a basket of six major currencies, trades around 101.28, recovering from an intraday low of 101.12.
Strategists at OCBC note that “a hold accompanied by hawkish guidance would likely push expected rate hikes further out the curve without materially altering the roughly 55bp of cumulative tightening priced in through mid-2027.” In their view, “in this scenario, the USD should remain supported.”
By contrast, OCBC cautions that “a decision to leave rates unchanged with little explanation could be interpreted as dovish and create confusion about the Fed's reaction function,” a misstep that “risks lifting long-end inflation breakevens, a development that would be negative for the USD.”
Technical analysis: XAU/USD consolidates near 21-day SMA
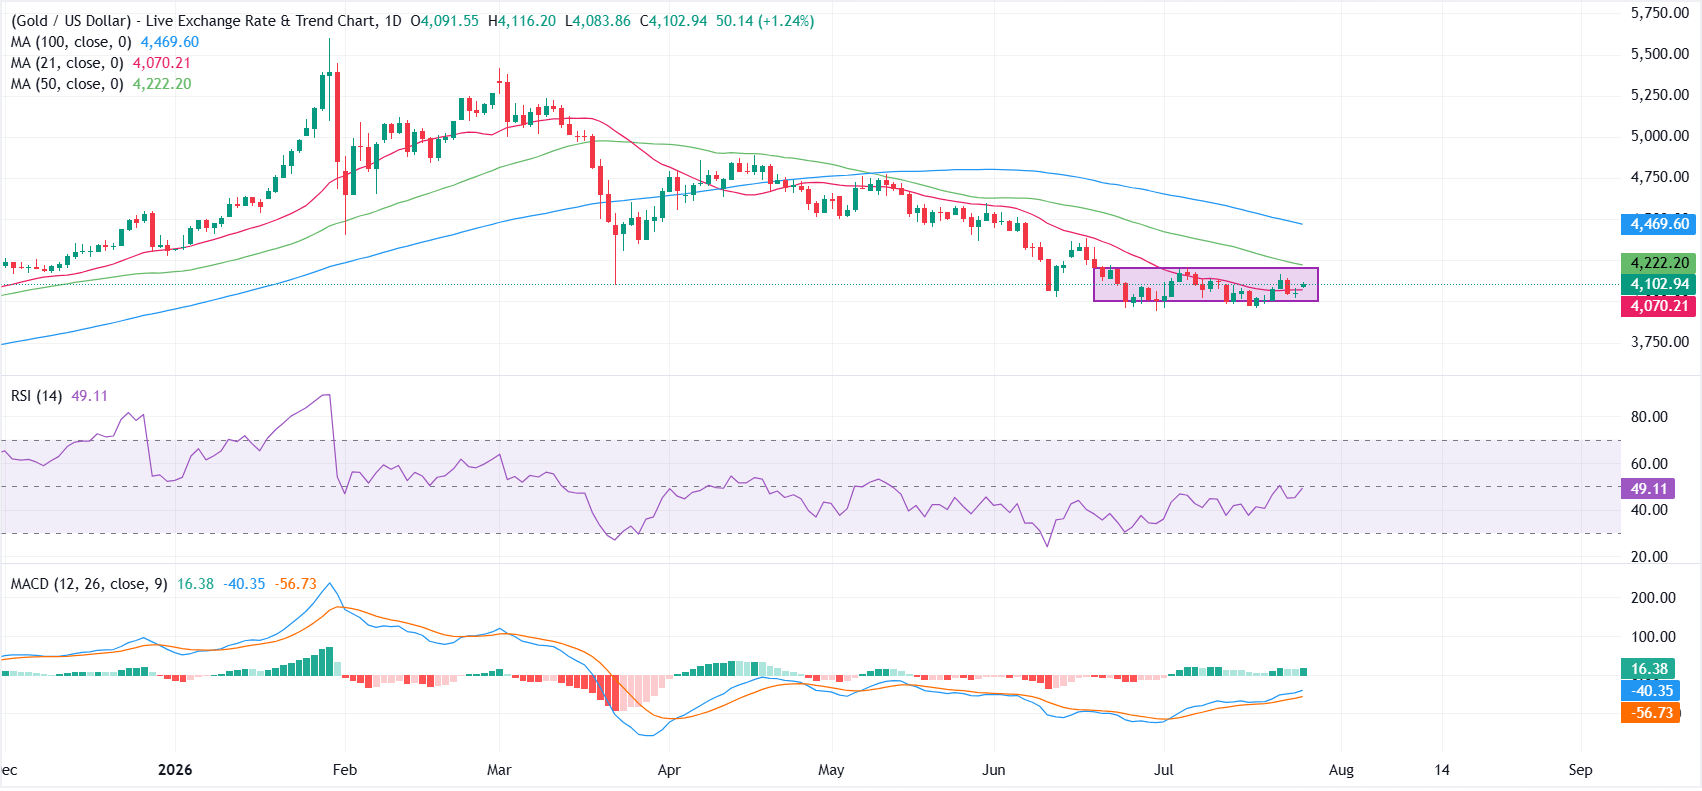
From a technical perspective, XAU/USD remains range-bound between $4,000 and $4,200, with prices fluctuating around the 21-day Simple Moving Average (SMA) at $4,070. The near-term outlook is neutral, although the broader bias stays bearish as the metal trades below the 50-day and 100-day SMAs at $4,222 and $4,470, respectively.
The Relative Strength Index (RSI) on the daily chart is at 49, leaning neutral, while the Moving Average Convergence Divergence (MACD) stays in positive territory, suggesting that downside momentum is limited even as the broader structure remains capped by overhead averages.
On the upside, the $4,200 psychological mark and the 50-day SMA at $4,222 form the initial resistance zone. A decisive break above this area could open the door toward the 100-day SMA at $4,470.
Initial support is seen at the 21-day SMA near $4,070, followed by the $4,000 level. A daily close below this level would expose deeper retracement, while holding above it would keep XAU/USD in a range, with bulls needing a clear move through $4,222 to regain control.
(The technical analysis of this story was written with the help of an AI tool. Know more.)
Recommended Articles


