


Two Elite Index Funds Compared: Which Deserves a Spot in Your Long-Term Portfolio?
Key Points
The Vanguard S&P 500 ETF and Schwab U.S. Broad Market ETF make it easy to buy the entire U.S. stock market at a rock-bottom expense ratio of 0.03%.
Although the Vanguard S&P 500 ETF has slightly outperformed it over the past 10 years, the Schwab fund might be a better buy right now.
Recent Vanguard research suggests that small-cap stocks could outperform large caps in the next 10 years, which might make the more broadly diversified Schwab fund a better choice.
- 10 stocks we like better than Schwab Strategic Trust - Schwab U.s. Broad Market ETF ›
Sometimes, when deciding how to invest your money, the best way to start is by purchasing index funds. These broadly diversified exchange-traded funds (ETFs) make it possible to own hundreds or thousands of stocks all at once, with low fees, and without having to pick individual shares.
The best index funds make it easy to invest in the entire U.S. stock market, as defined by the 500 largest companies in the S&P 500. For example, the Vanguard S&P 500 ETF (NYSEMKT: VOO) has more than $1 trillion in investor assets tracking the performance of the S&P 500.
Where to invest $1,000 right now? Our analyst team just revealed what they believe are the 10 best stocks to buy right now, when you join Stock Advisor. See the stocks »
Other index funds let you own even more stocks than that, all in one trade and one ticker. The Schwab U.S. Broad Market ETF (NYSEMKT: SCHB) holds more than 2,000 stocks of all sizes, not just the 500 largest.
Both VOO and SCHB are well-regarded U.S. stock ETFs that made the list of best low-cost index funds. Let's see which ETF could be a better choice for long-term investors.

Image source: Getty Images.
Vanguard S&P 500 ETF: 506 stocks, 10 years of 15.5% annualized returns
The Vanguard S&P 500 ETF is one of the most popular ETFs in the world and a foundational piece of many investors' portfolios. That's because this fund is an ultra-low-cost (0.03% expense ratio) way to buy the entire S&P 500 index. It holds 506 large-cap stocks representing all 500 companies in this U.S. stock market benchmark.
In the past 10 years, this Vanguard ETF has delivered average annual returns (by net asset value) of 15.47% -- and 22.28% in the past year.
As the artificial intelligence (AI) trade has gained momentum in the past few years, the S&P 500 has grown a bit more tech-heavy. In keeping with that trend, tech stocks are now this fund's top sector by weight, making up 38% of the fund. The other top sector holdings include financials (a distant second at 11.8% of the fund), communication services (9.7%), consumer discretionary (9.3%), and healthcare (8.9%).
Schwab U.S. Broad Market ETF: 2,350 stocks, 10 years of 15% annualized returns
The Schwab U.S. Broad Market ETF is an even more diversified U.S. stock index fund. This ETF holds a total of 2,350 stocks, including large caps, mid caps, and small caps. It charges the same ultra-low expense ratio (0.03%) as the Vanguard fund.
In the past 10 years, the Schwab fund has delivered average annual returns (by net asset value) of 15.04%, slightly underperforming the Vanguard S&P 500 ETF. In the past year, the Schwab ETF has delivered a return of 23% by net asset value.
Compared to the Vanguard fund, which tracks the 500 largest U.S. stocks, the Schwab fund is a little less tech-heavy. The Schwab U.S. Broad Market ETF's top sector holdings are:
- Information technology: 31.06% of the fund
- Financials: 12.91%
- Industrials: 10.3%
- Healthcare: 9.94%
- Consumer discretionary: 9.87%
No one knows which sector or company size might do better in the future. But if you are concerned that major tech names are overvalued and want to own a broader range of stocks that includes small caps, the Schwab fund might be a better choice than VOO.
Why buy SCHB instead of VOO?
It's tough to bet against one of the best S&P 500 ETFs. Over the past 10 years, the Vanguard S&P 500 ETF outperformed the Schwab fund, with total returns about 17% higher.
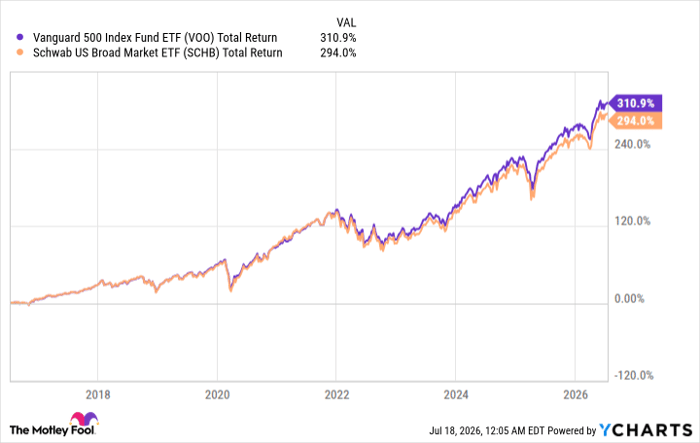
VOO Total Return Level data by YCharts
But as always, past performance doesn't guarantee future results. Recent research from Vanguard forecasted that small-cap stocks might be poised to outperform large-cap stocks by about 1 to 3 percentage points per year for the next 10 years.
The Schwab U.S. Broad Market ETF is not a small-cap ETF; it also owns plenty of large-cap stocks. But by diversifying across a wider portfolio of companies of all sizes, the Schwab U.S. Broad Market ETF might be a better choice for long-term investors than VOO.
Should you buy stock in Schwab Strategic Trust - Schwab U.s. Broad Market ETF right now?
Before you buy stock in Schwab Strategic Trust - Schwab U.s. Broad Market ETF, consider this:
The Motley Fool Stock Advisor analyst team just identified what they believe are the 10 best stocks for investors to buy now… and Schwab Strategic Trust - Schwab U.s. Broad Market ETF wasn’t one of them. The 10 stocks that made the cut could produce monster returns in the coming years.
Consider when Netflix made this list on December 17, 2004... if you invested $1,000 at the time of our recommendation, you’d have $371,842!* Or when Nvidia made this list on April 15, 2005... if you invested $1,000 at the time of our recommendation, you’d have $1,244,783!*
Now, it’s worth noting Stock Advisor’s total average return is 900% — a market-crushing outperformance compared to 207% for the S&P 500. Don't miss the latest top 10 list, available with Stock Advisor, and join an investing community built by individual investors for individual investors.
See the 10 stocks »
*Stock Advisor returns as of July 21, 2026.
Ben Gran has no position in any of the stocks mentioned. The Motley Fool has positions in and recommends Vanguard S&P 500 ETF. The Motley Fool has a disclosure policy.
Recommended Articles


