


Gold climbs as buyers defend $4,000, hawkish Fed expectations limit upside
- Gold rebounds from the $4,000 area as markets monitor the latest US-Iran developments.
- Elevated Oil prices and the prospect of tighter Federal Reserve policy limit the metal’s upside.
- XAU/USD tests the Bollinger midline near $4,062, with the $4,175 upper band acting as the next resistance.
Gold (XAU/USD) edges higher on Tuesday as buying interest around the $4,000 psychological level supports prices, while traders assess developments in the Middle East and their potential economic fallout. At the time of writing, XAU/USD trades around $4,058, up 1.27% on the day.
The United States military carried out a tenth consecutive night of strikes against Iran, while Iran’s Revolutionary Guards targeted US military assets across the region.
Despite the continued military exchanges, diplomatic efforts are underway. The Associated Press reported that Iranian officials began meeting with mediators in Pakistan on Tuesday. Reuters reported on Monday that mediators had offered Tehran a 10-day ceasefire to try to bring last month’s interim agreement back on track.
With the situation still in flux, the US Dollar (USD) remains the preferred safe-haven asset, while Oil prices hold close to their highest level in more than a month. The US Dollar Index (DXY), which tracks the Greenback's value against a basket of six major currencies, is hovering just below the 101.00 mark, little changed on the day.
Although Gold is attempting to establish a base above the $4,000 psychological level, its upside remains limited as elevated energy prices stoke inflation concerns and strengthen expectations that the Federal Reserve (Fed) will keep monetary policy tighter for longer or even raise interest rates.
Higher borrowing costs reduce Gold's appeal, prompting investors to rotate toward interest-bearing assets such as government bonds.
Dollar support builds as Gulf tensions weigh on gold
Analysts at ING note that “the FX market is gradually catching up with developments in the Gulf, where tensions still appear to be escalating, and the Dollar has found broad-based support.” They highlight that US President Donald Trump has “pledged retaliation against Iran following the killing of three US service members in Jordan,” while Houthi militants are “threatening a blockade of Saudi Arabia in the Red Sea,” reinforcing the bid for the Dollar as geopolitical risks intensify.
Strategists at OCBC say Gold has "continued to consolidate around recent lows following the sharp pullback earlier this month," adding that "near term, price action may remain two-way, but a more sustained recovery likely requires oil prices to back off, some easing in real yields and Fed tightening expectations. Until then, upside may remain capped."
Technical analysis: XAU/USD stabilizes above $4,000
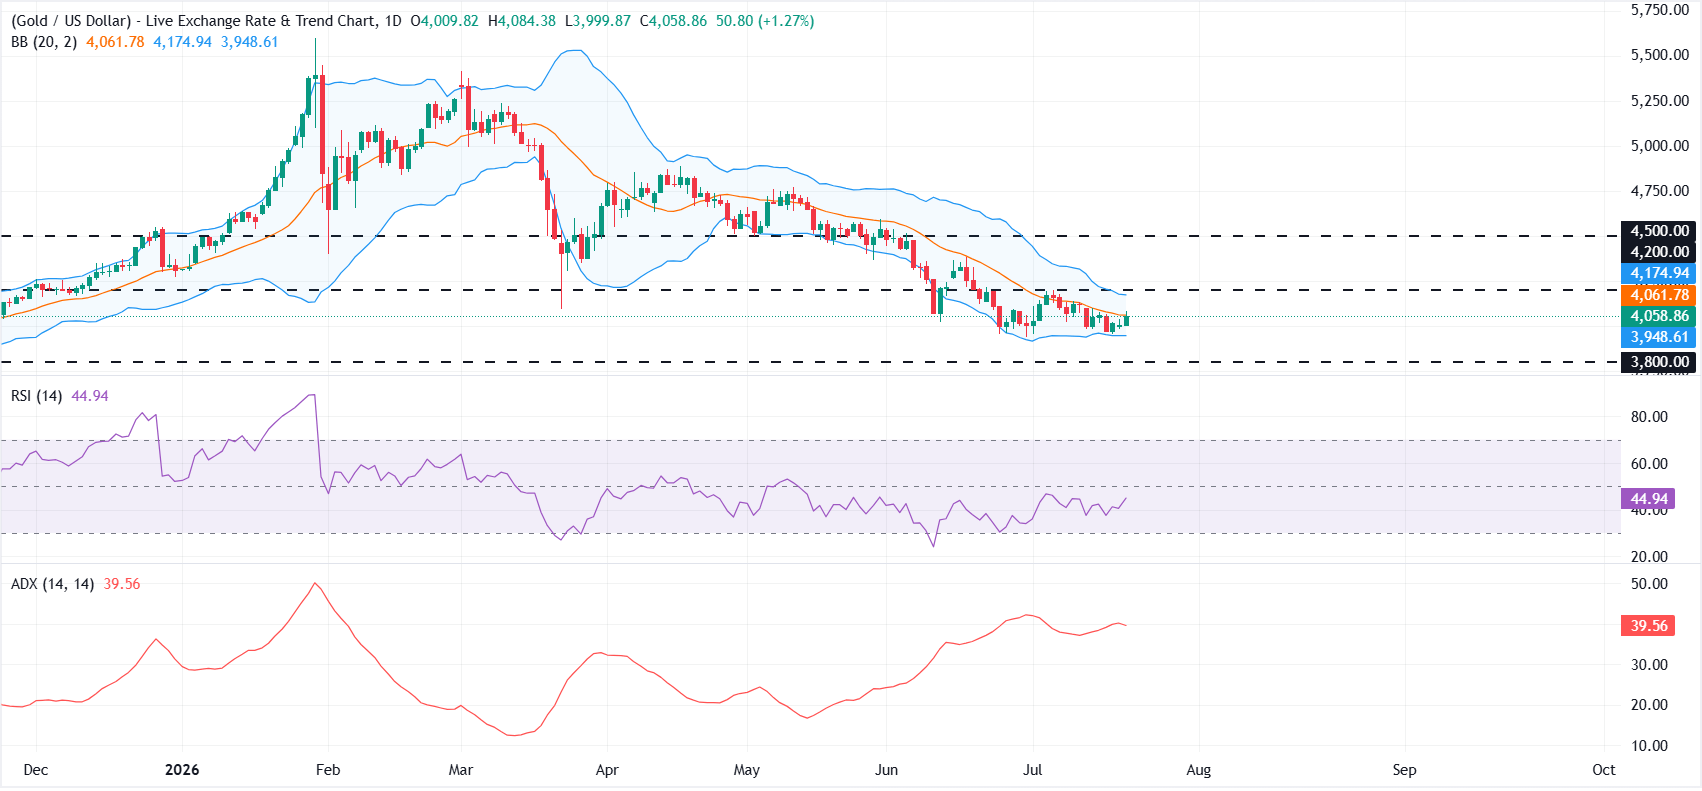
XAU/USD is testing the 20-day Simple Moving Average (SMA) at $4,062. The Relative Strength Index (RSI) at 45 on the daily chart is below the neutral 50 level, indicating weak bullish momentum. Meanwhile, the Average Directional Index (ADX) near 39 suggests the prevailing trend remains strong despite the near-term stabilization.
On the downside, immediate support lies at the $4,000 psychological level, followed by the lower Bollinger Band at $3,948. A break below this area could expose the horizontal support at $3,800.
On the topside, a sustained move above the Bollinger midline at $4,062 could open the door toward the upper band at $4,175, followed by the $4,200 resistance level. A decisive break above $4,200 would bring the more distant $4,500 barrier into focus.
(The technical analysis of this story was written with the help of an AI tool. Know more.)
Gold FAQs
Gold has played a key role in human’s history as it has been widely used as a store of value and medium of exchange. Currently, apart from its shine and usage for jewelry, the precious metal is widely seen as a safe-haven asset, meaning that it is considered a good investment during turbulent times. Gold is also widely seen as a hedge against inflation and against depreciating currencies as it doesn’t rely on any specific issuer or government.
Central banks are the biggest Gold holders. In their aim to support their currencies in turbulent times, central banks tend to diversify their reserves and buy Gold to improve the perceived strength of the economy and the currency. High Gold reserves can be a source of trust for a country’s solvency. Central banks added 1,136 tonnes of Gold worth around $70 billion to their reserves in 2022, according to data from the World Gold Council. This is the highest yearly purchase since records began. Central banks from emerging economies such as China, India and Turkey are quickly increasing their Gold reserves.
Gold has an inverse correlation with the US Dollar and US Treasuries, which are both major reserve and safe-haven assets. When the Dollar depreciates, Gold tends to rise, enabling investors and central banks to diversify their assets in turbulent times. Gold is also inversely correlated with risk assets. A rally in the stock market tends to weaken Gold price, while sell-offs in riskier markets tend to favor the precious metal.
The price can move due to a wide range of factors. Geopolitical instability or fears of a deep recession can quickly make Gold price escalate due to its safe-haven status. As a yield-less asset, Gold tends to rise with lower interest rates, while higher cost of money usually weighs down on the yellow metal. Still, most moves depend on how the US Dollar (USD) behaves as the asset is priced in dollars (XAU/USD). A strong Dollar tends to keep the price of Gold controlled, whereas a weaker Dollar is likely to push Gold prices up.
Recommended Articles


