


Top Altcoins Price Forecast: Uniswap lead gains, Cardano and NEAR risk rejection at EMAs resistance
- Uniswap reached a six-month high after rallying more than 10% to $4.42 upon the unveiling of Launches.
- Cardano posted a 5% rise following higher open interest and funding rates.
- NEAR rose toward the $1.70 mark after launching AI-enabled staking, enabling investors to receive compute credits for processing AI workloads.
Top altcoins Uniswap (UNI), Cardano (ADA) and Near Protocol (NEAR) all saw gains on Thursday after a slight recovery across the crypto market.
UNI rallied over 10% on Thursday, reaching a six-month high after unveiling Launches, a new feature in its Web App that aggregates tokens across launchpads that leverages the decentralized exchange as their trading infrastructure.
The feature allows users to access these tokens across different launchpads within a single tab in the app.
"The tab pulls tokens from the top launchpads into a single feed. You can filter by launchpad or sort by 24-hour volume, liquidity, recently launched, or trending," Uniswap stated in a Thursday announcement.
The feature will initially go live on the Robinhood Chain, with plans to expand to other chains. So far in July, Uniswap has recorded more than 340K new token launches via Robinhood Chain launchpads, with $3.6 billion in trading volume, the DEX claimed.
On the daily chart, UNI is extending its advance above the short- and medium-term trend supports. The 20-, 50- and 100-day Exponential Moving Averages (EMAs) at $3.73, $3.46 and $3.42, respectively, sit well below spot price and suggest a constructive bullish structure. The rally is reinforced by the reclaimed horizontal floor at $4.20.
Momentum is stretched, with the 14-day Relative Strength Index (RSI) near 74 and the Stochastic Oscillator (Stoch) above 96, hinting at overbought conditions that could slow the upside rather than immediately reverse it.
On the topside, initial resistance is seen at the horizontal barrier around $5.14, ahead of a stronger cap near $6.51.
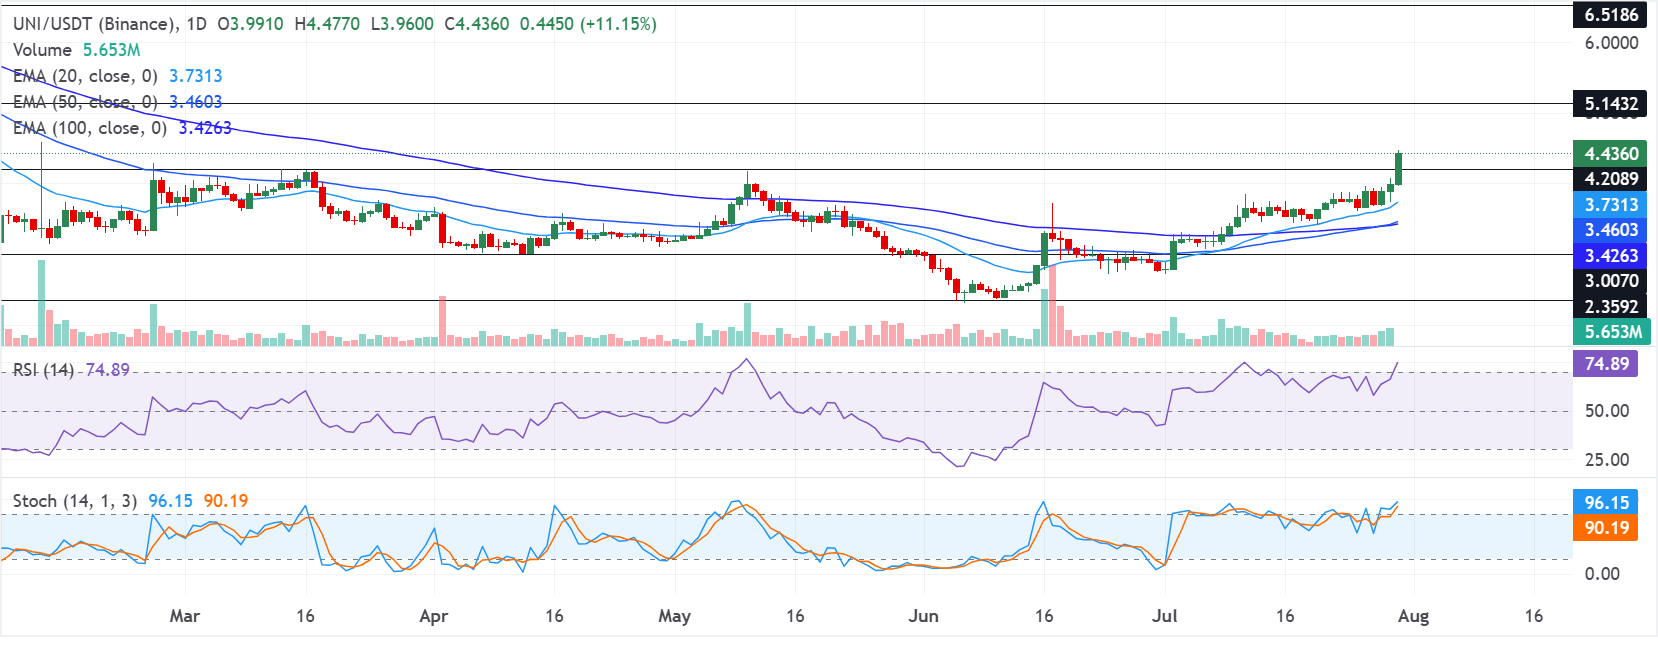
On the downside, immediate support is found at the prior breakout level at $4.20, while deeper pullbacks would likely be cushioned by the EMAs. Below these, more distant structural supports align at $3 and $2.35.
Cardano and NEAR register 5% gains but face EMA overhead resistance
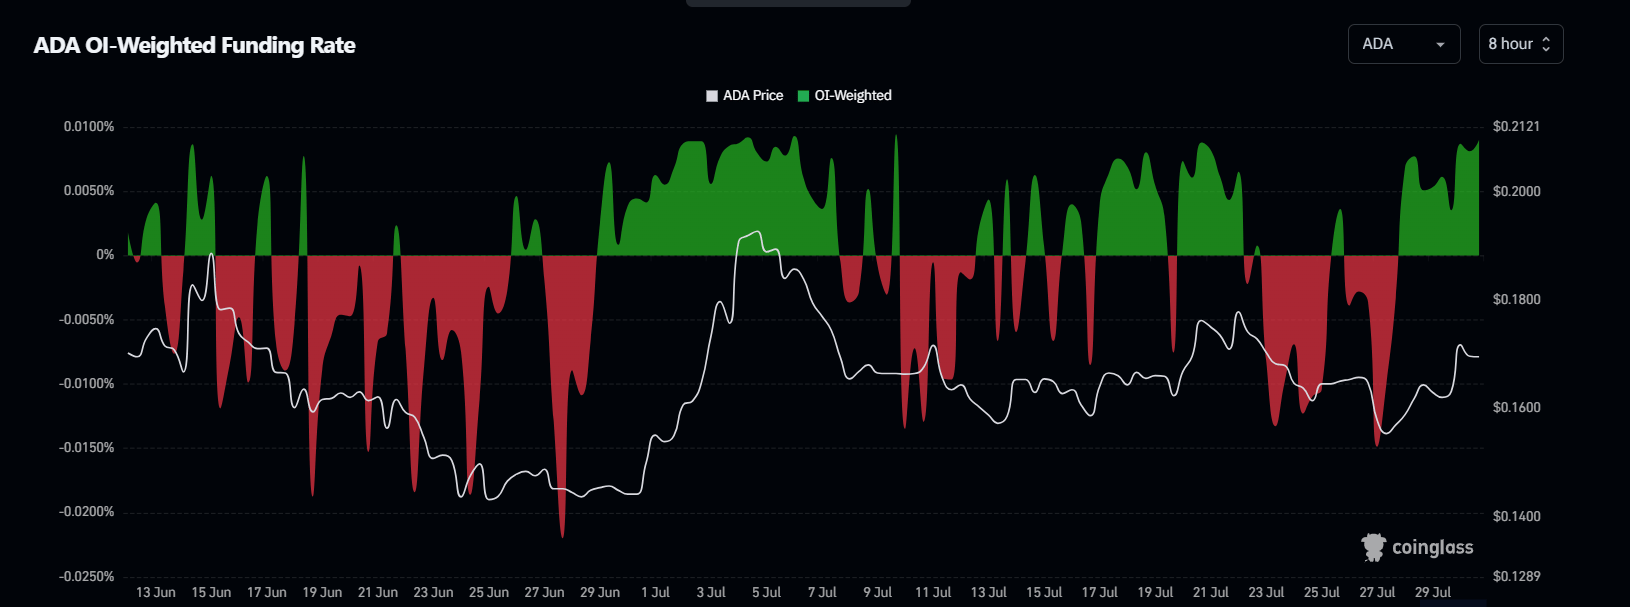
ADA recorded a 5% gain on Thursday, rising above $0.170 alongside a majority of top altcoins. The growth is supported by rising open interest (OI) and funding rates in the token.
Open interest increased by 8% from 2.28 billion ADA to 2.47 billion ADA over the past 24 hours, while funding rates have remained positive since Tuesday, after roughly five days of heavy negative readings.
On the daily chart, ADA is keeping the broader tone mildly bearish despite the recent bounce as it faces resistance near the 20- and 50-day EMAs. The RSI and Stoch are hovering near 53 and 60, hinting at improving momentum, yet this strength would need a firm break of the nearby EMA barriers to translate into a more durable recovery.
On the topside, initial resistance emerges at the 50-day EMA around $0.174, with a stronger supply zone seen near the horizontal barrier at $0.194 and the 100-day EMA at $0.197. Further resistance is at $0.220.
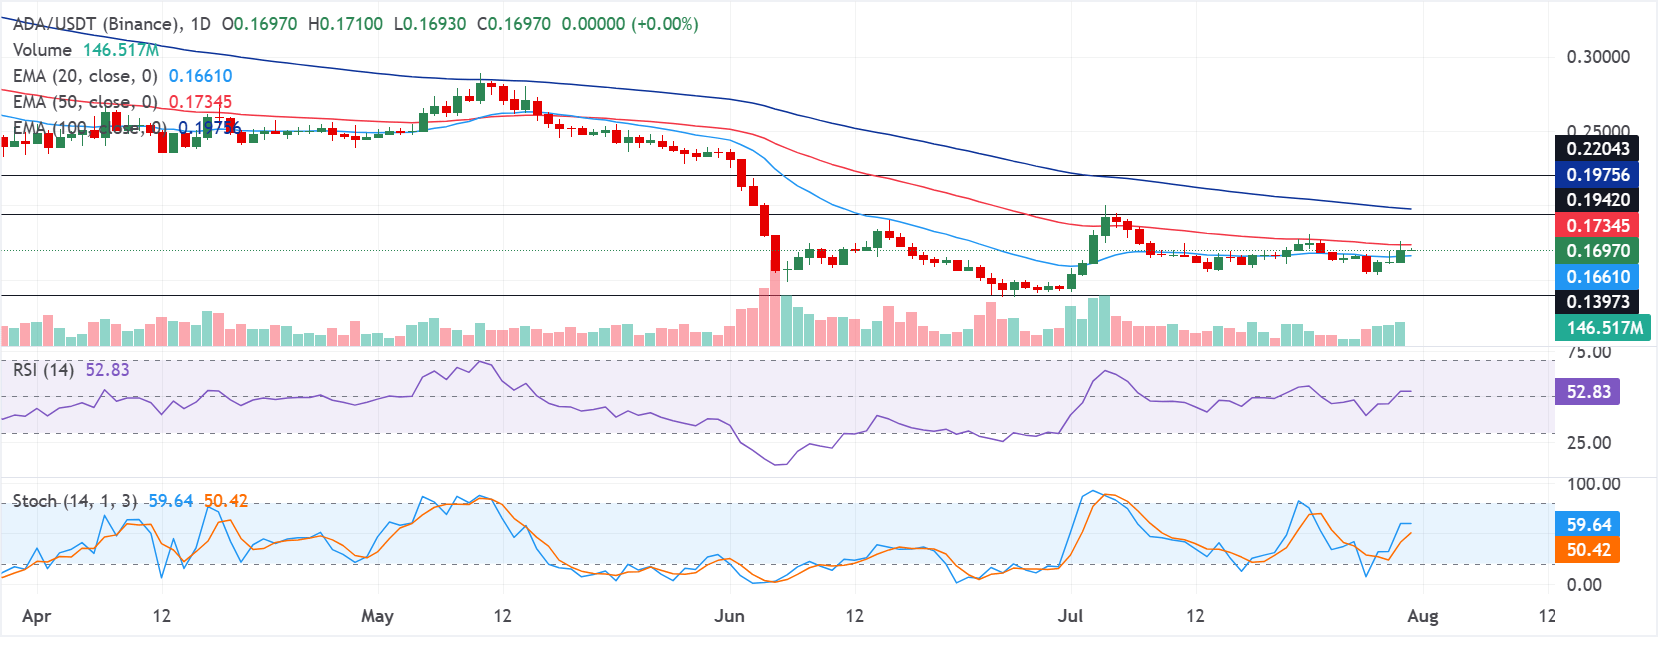
On the downside, a decline below the 20-day EMA would expose the horizontal floor near $0.139 as the next significant demand area.
Meanwhile, NEAR is up 5% and is approaching the $1.70 mark following the launch of a staking-based payment mechanism for NEAR AI. By locking up tokens in staking contracts, the feature provides users with compute credits to access the 43 models on NEAR AI across several providers including OpenAI, Anthropic and Google.
"AI usage denominated through staking increases the amount of NEAR locked while compute is active, creating a utility-driven source of token lockup," wrote NEAR Protocol in an X post.
On the daily chart, NEAR retains a bearish near-term bias as price holds below the 20-, 50- and 100-day EMAs at $1.81, $1.88 and $1.84, respectively, underscoring a market capped by clustered overhead supply. The RSI around 37 hints at persistent weak momentum, while the Stoch near 19 suggests oversold conditions that could allow for brief corrective bounces within the broader downside context.
On the topside, initial resistance is seen at the horizontal barrier around $1.72, followed by the EMAs. Beyond that, stronger resistance is located at $2.13 and then $2.31.
On the downside, immediate support appears at $1.46, with a deeper floor near $1.26, and a break below the former would open the door to an extension of the current bearish phase.
(The technical analysis of this story was written with the help of an AI tool. Know more.)
Recommended Articles


