

Hyperliquid Price Forecast: ETF outflows deepen slide toward $50

Source Fxstreet
  • Hyperliquid extends its decline on Wednesday, breaking below a key support zone and falling over 8% so far this week.
  • HYPE’s spot ETFs recorded an outflow of $1.24 million on Tuesday, marking four consecutive days of withdrawals.
  • The technical outlook suggests a further correction toward the next key support level around the 200-day EMA at $50.80.

Hyperliquid (HYPE) continues to extend its losses, trading below $54.80 at the time of writing on Wednesday after falling over 8% so far this week. Weakening institutional demand supports this correction, and a deteriorating technical outlook suggests deeper losses ahead.

Weakening institutional demand

Institutional demand shows weakening signs. SoSoValue data shows that US-listed spot HYPE ETFs recorded outflows of $1.24 million on Tuesday, marking four consecutive days of withdrawals. If these outflows continue and intensify through the week, HYPE could extend its correction.
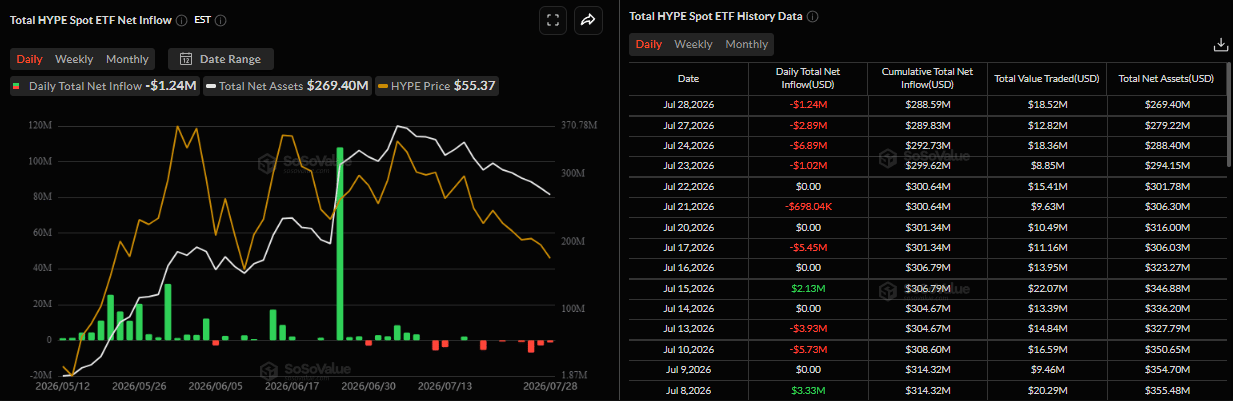
Total HYPE spot ETF net daily chart. Source: SoSoValue

Derivatives data shows a slight bearish tilt. CoinGlass’ long-to-short ratio for HYPE read 0.95 on Wednesday, nearing its lowest levels in over a month. A ratio below 1 indicates bearish sentiment, as traders bet that asset prices will fall.
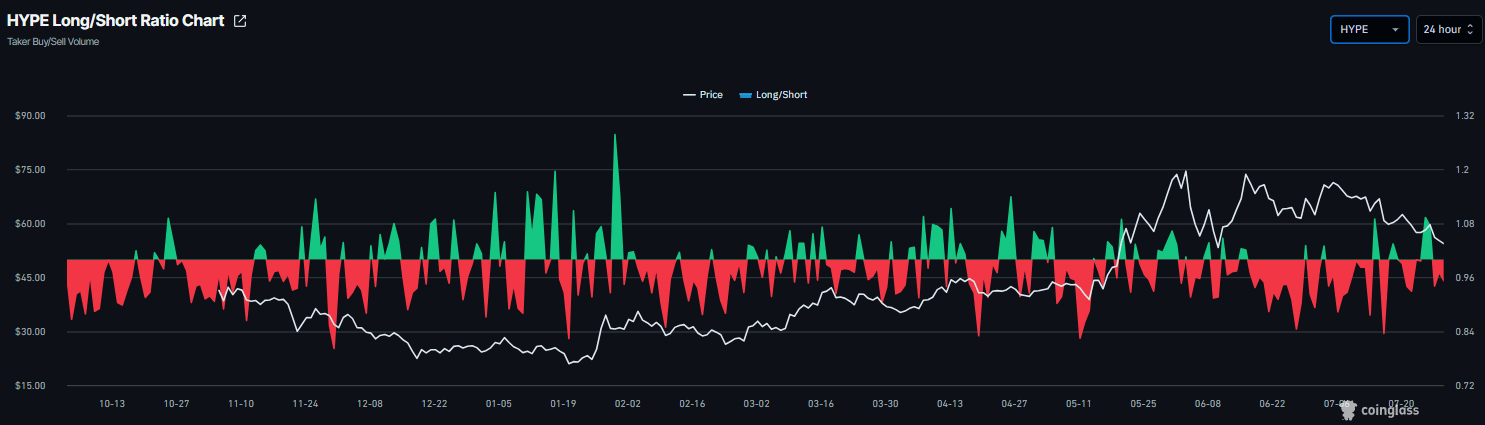
HYPE long-to-short chart. Source: Coinglass

Hyperliquid Price Forecast: Momentum indicators show bearish bias

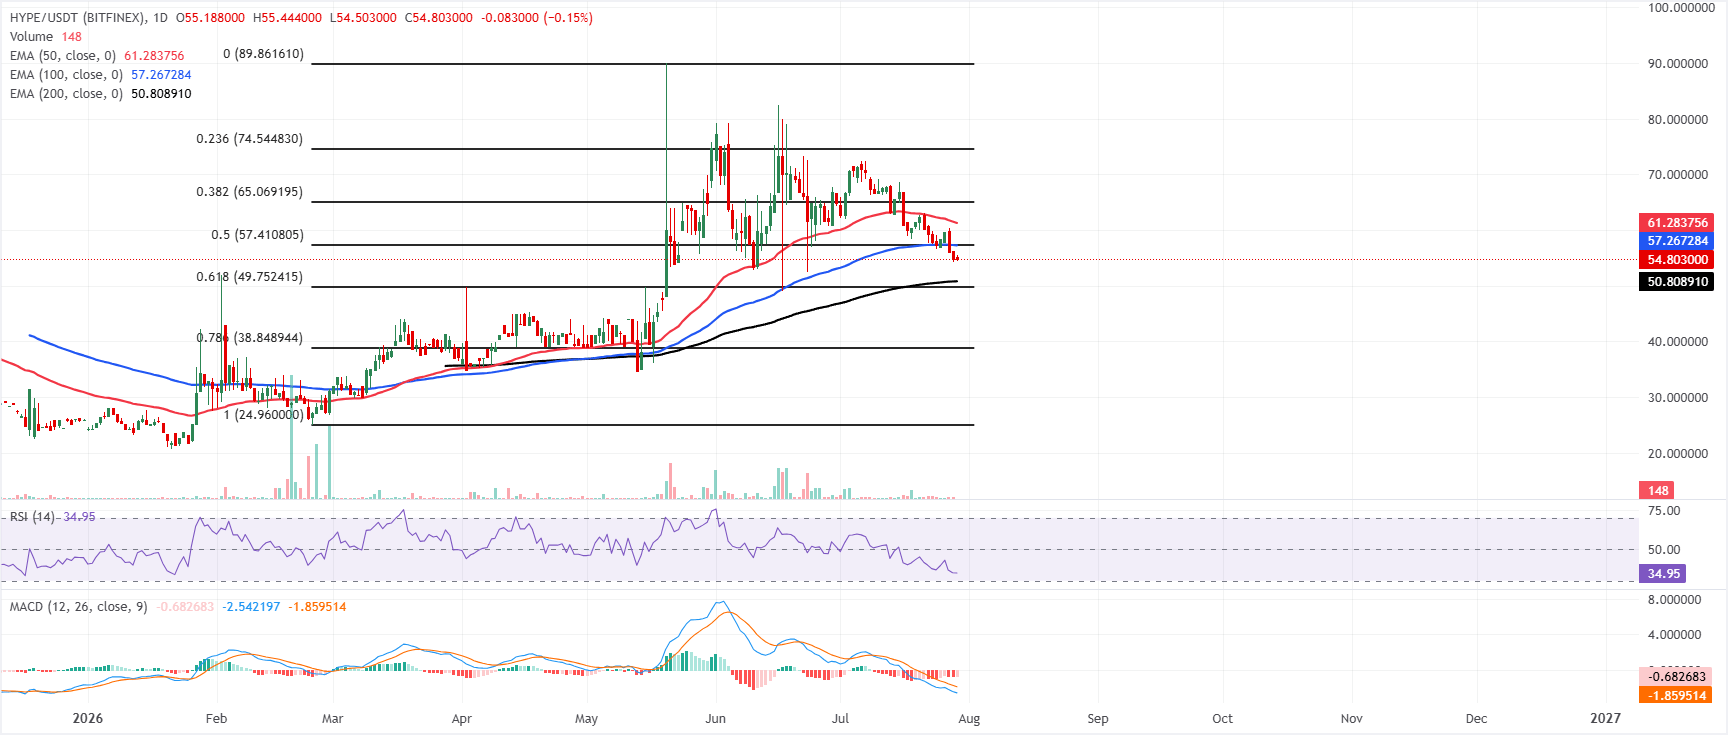
Hyperliquid price trades at $54.80 on Wednesday, holding a soft bearish tone after slipping below the mid-range Exponential Moving Averages (EMAs). Price sits above the 200-day EMA at $50.80, but remains capped beneath the 100-day EMA at $57.26, keeping the broader structure under pressure.

The Relative Strength Index (RSI) near 35 indicates weak downside momentum. At the same time, the Moving Average Convergence Divergence (MACD) remains negative, suggesting rallies are likely to face selling pressure as the pair trades below clustered resistance overhead.

On the topside, initial resistance is seen at the 100-day EMA and the 50% retracement around $57.30–$57.40, with the 50-day EMA near $61.28 as the next barrier, ahead of the 38.2% Fibonacci retracement at $65.07.

On the downside, immediate support emerges at the 200-day EMA around $50.80, followed by the 61.8% Fibonacci retracement level at $49.75; a break below this band would expose deeper retracement supports at $38.85 and $24.96, where buyers could attempt to stabilize the broader pullback.
(The technical analysis of this story was written with the help of an AI tool. Know more.)

Disclaimer: For information purposes only. Past performance is not indicative of future results.
placeholder
Gold Price Analysis (XAU/USD): Gold Falls to 6-Month Low as Inflation Fuels Rate Hike Bets, A Buying Opportunity or a Falling Knife? Gold hit a 6-month low on Fed rate hike bets. However, strong central bank buying and technical indicators suggest potential tactical bounces and long-term accumulation windows.
Author  Mitrade Team
6 Month 12 Day Fri
Gold hit a 6-month low on Fed rate hike bets. However, strong central bank buying and technical indicators suggest potential tactical bounces and long-term accumulation windows.
placeholder
XRP Price Prediction for July 2026: Can Buyers Finally Break the Downtrend?XRP (XRP) price trades near $1.05, caught between a year-long downtrend and a sudden burst of buying.July has historically rewarded XRP holders. This year the month arrives with on-chain accumulation
Author  Beincrypto
6 Month 30 Day Tue
XRP (XRP) price trades near $1.05, caught between a year-long downtrend and a sudden burst of buying.July has historically rewarded XRP holders. This year the month arrives with on-chain accumulation
placeholder
What to Expect From Ethereum (ETH) in July 2026Ethereum (ETH) enters July 2026 trading near $1,570, close to multi-month lows, after recording its first run of three consecutive red quarterly candles in its history.On-chain data and price charts n
Author  Beincrypto
7 Month 01 Day Wed
Ethereum (ETH) enters July 2026 trading near $1,570, close to multi-month lows, after recording its first run of three consecutive red quarterly candles in its history.On-chain data and price charts n
placeholder
NVIDIA Price Forecast: Michael Burry Shorts NVDA, but Analysts See $299On July 1, NVIDIA (NASDAQ: NVDA) sits at $198.34, failing to break above the former support level that is now serving as resistance between $198 and $205 on the 2H chart's downward blue c
Author  TradingKey
7 Month 02 Day Thu
On July 1, NVIDIA (NASDAQ: NVDA) sits at $198.34, failing to break above the former support level that is now serving as resistance between $198 and $205 on the 2H chart's downward blue c
placeholder
Meta Compute Launch Sends AI Compute Stocks Tumbling GloballyMeta’s plan to sell surplus computing power hit chip stocks hard on Wall Street. Meta’s own shares climbed nearly 9% on the news.The announcement flipped years of assumed AI compute scarcity into a su
Author  Beincrypto
7 Month 02 Day Thu
Meta’s plan to sell surplus computing power hit chip stocks hard on Wall Street. Meta’s own shares climbed nearly 9% on the news.The announcement flipped years of assumed AI compute scarcity into a su
goTop
quote