


Solana Price Prediction: SOL lacks directional move amid weak demand
- Solana hovers above $75 on Monday, testing its 50-day EMA at $76.54 after a 3% surge the previous day.
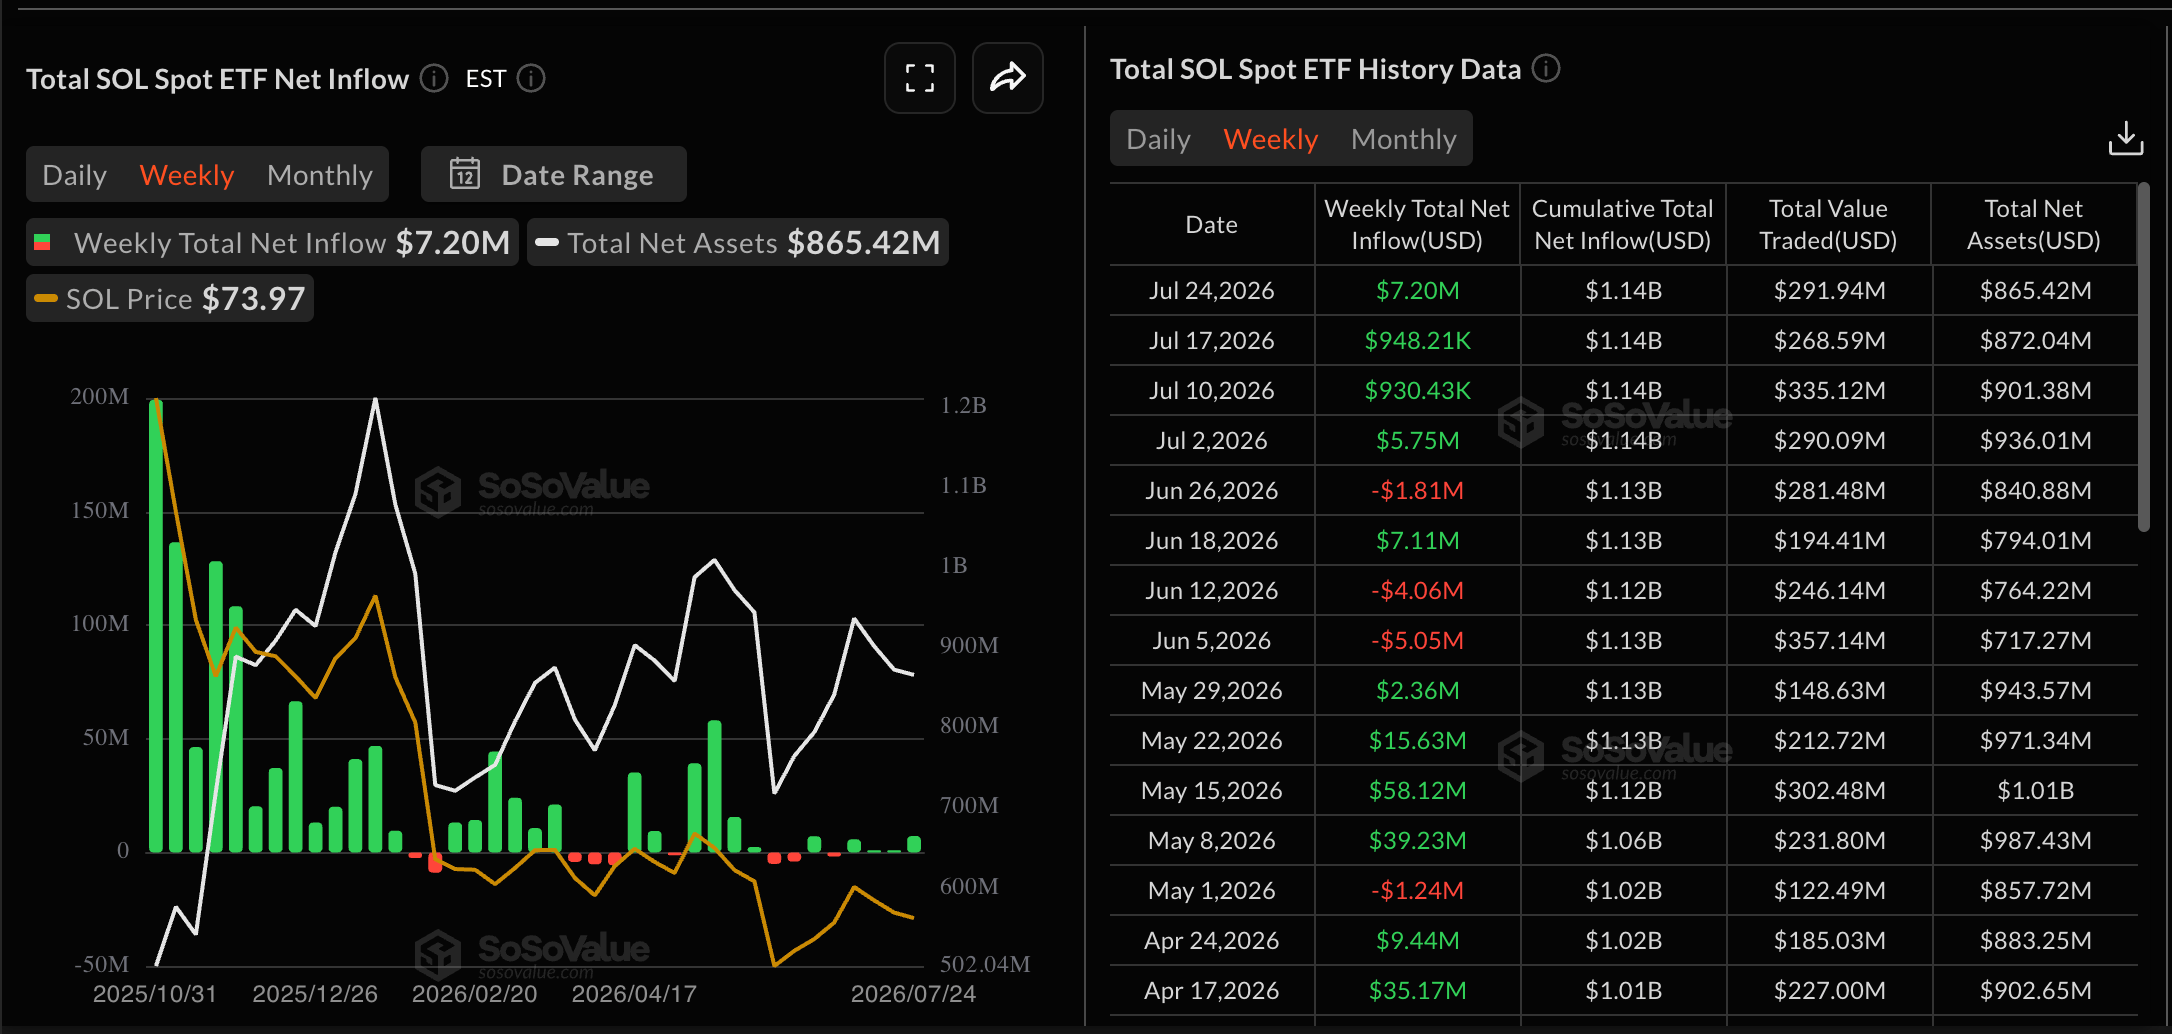
- SOL-focused ETFs recorded $7.20 million in inflows, marking their fourth consecutive week of inflows.
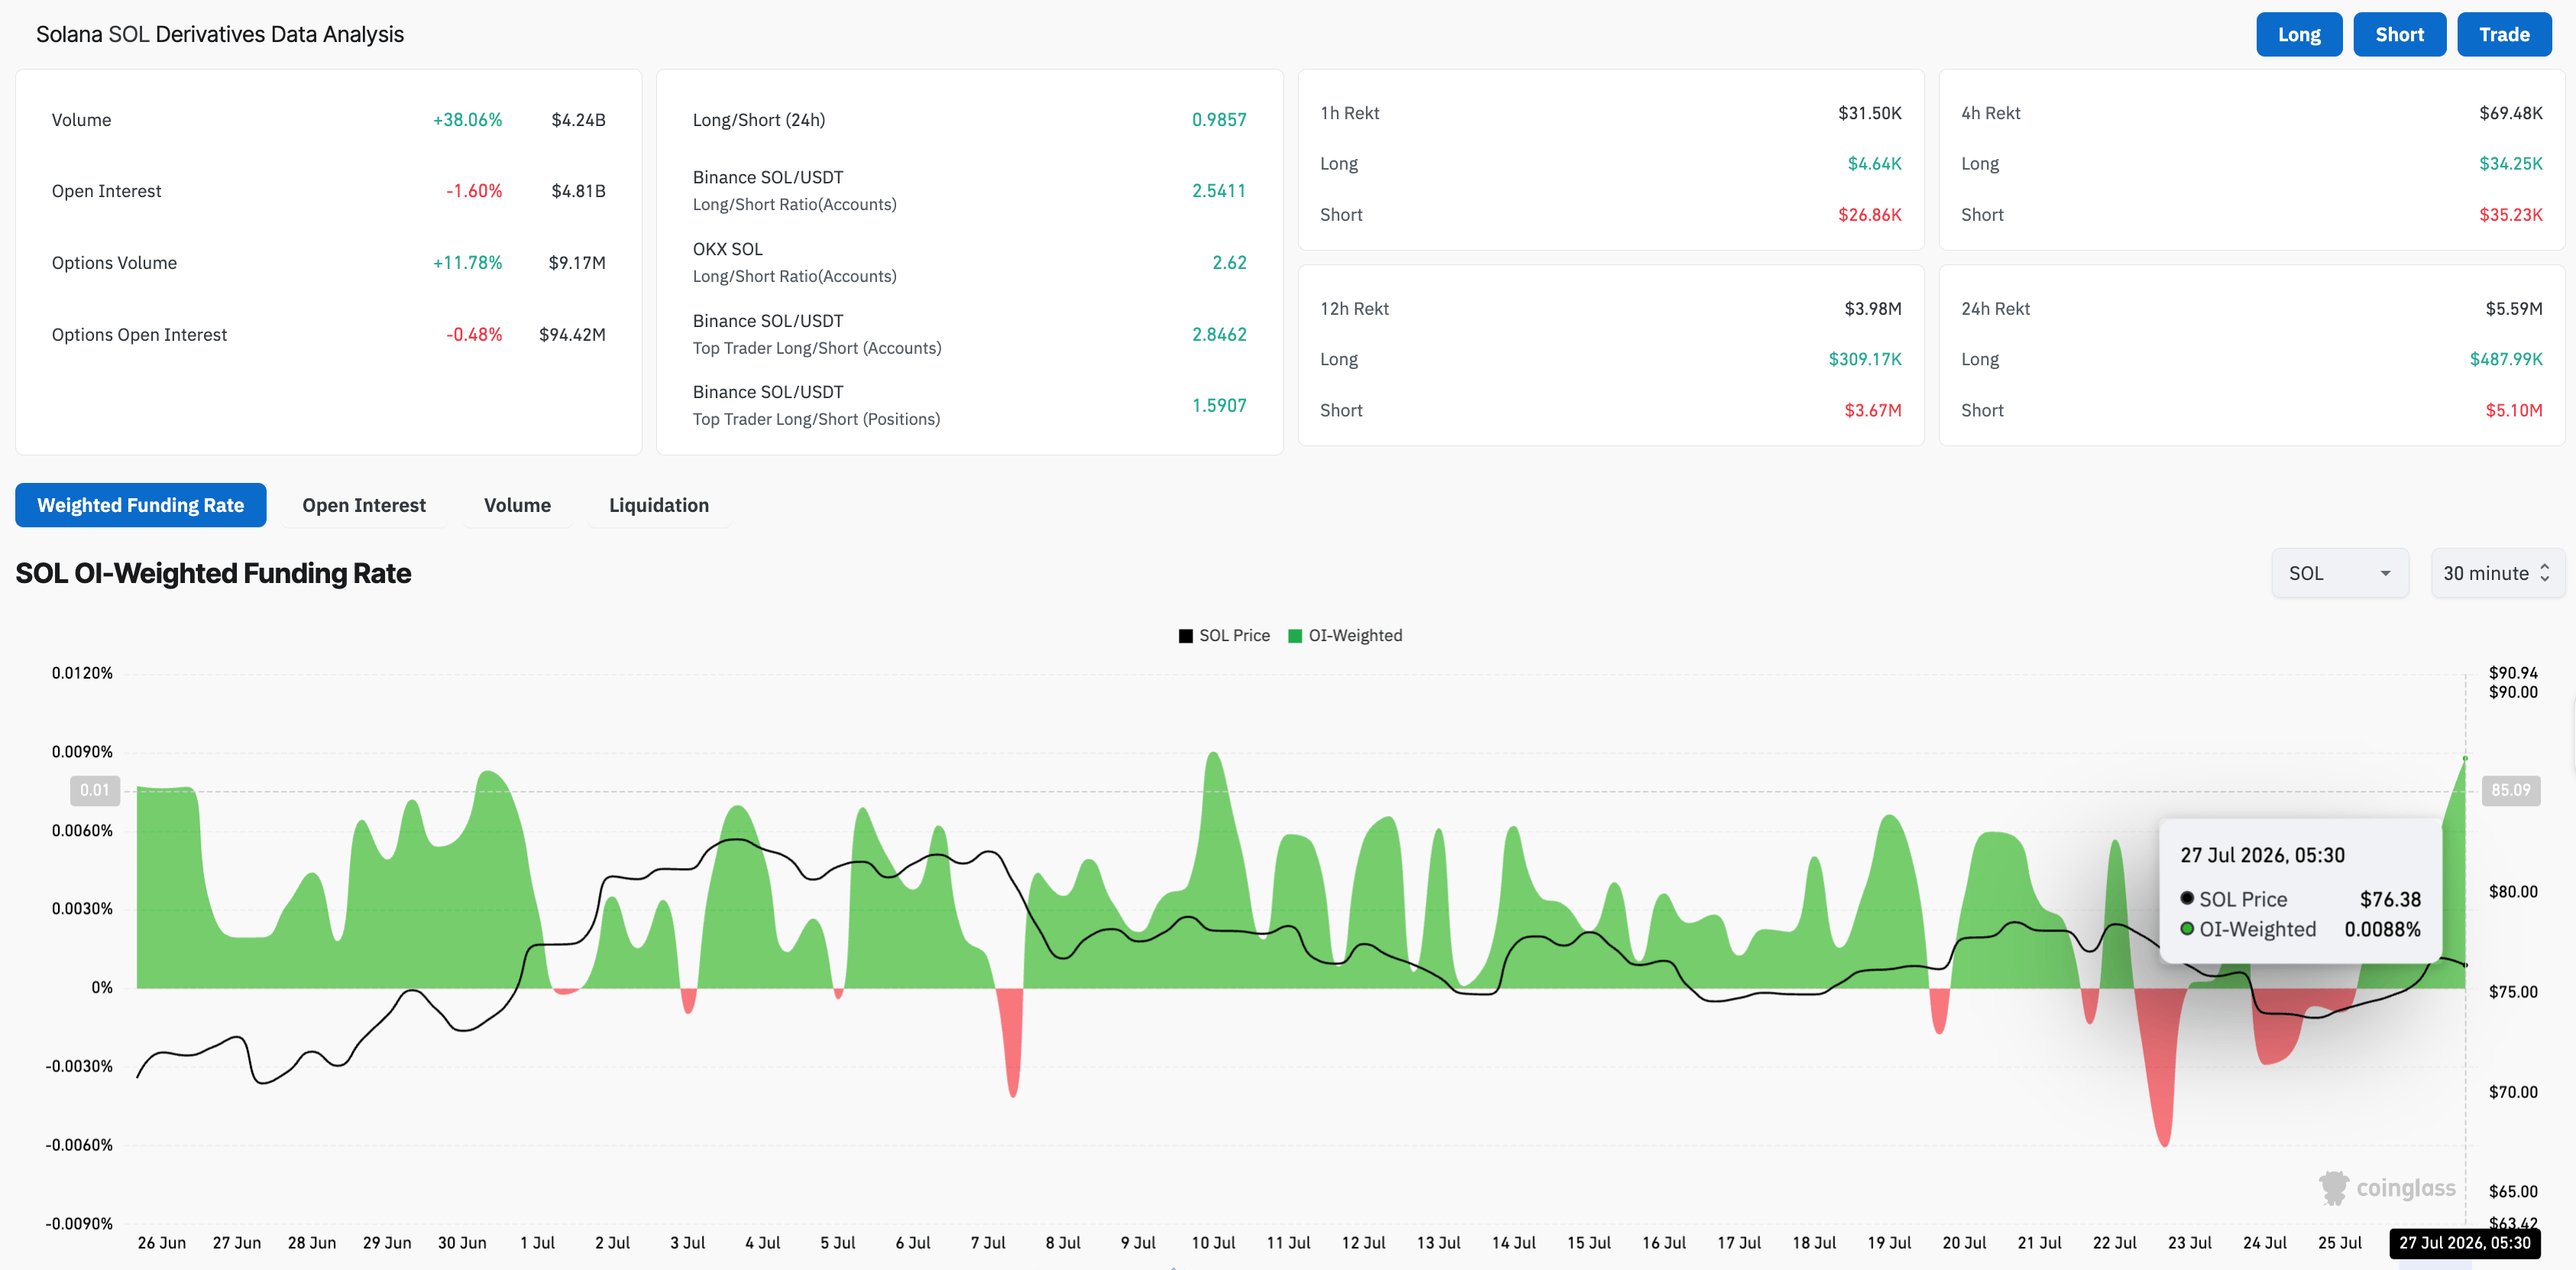
- Derivatives market signals mixed demand for SOL as Open Interest eases amid a positive spike in the funding rate.
Solana (SOL) price edges lower on Monday, following a 3% recovery the previous day. Institutional investors show mild demand for SOL with $7.20 million in inflows last week, but retail demand is mixed with declining Open Interest despite a positive surge in the funding rate.
The technical outlook for SOL is mixed, with price consolidating within a symmetrical triangle pattern as momentum wanes.
Demand remains mixed for SOL
Institutional interest in Solana remains muted, while retail activity shows mixed sentiment. SoSoValue data show that the SOL-focused ETFs recorded $7.20 million in inflows last week, bringing total inflows to $11.80 million so far in June. This marks the fourth consecutive weekly inflow in SOL ETFs, but remains subdued compared to over $20 million in weekly inflows seen earlier this year.
On the retail front, CoinGlass data shows the SOL Open Interest (OI) has contracted by 1.60% over the last 24 hours to $4.81 billion, while volume has increased by 38% to $4.24 billion. This suggests that retail activity is rising while the highly leveraged positional buildup is being trimmed.
At the same time, the positive spike in the funding rate to 0.0088%, up from 0.0060% the previous day, indicates that renewed retail activity prefers to acquire long positions at a premium.
Will SOL price rise above $80?
Solana price tests the 50-day Exponential Moving Average (EMA) at $76.54 on Monday, following a 3% recovery the previous day. The price is well below the 200-day EMA at $92.36, which together suggests a still-fragile broader trend.
From a technical perspective, the downward resistance trendline near $78.29 reinforces the cluster of supply above spot. In addition, the 50% retracement level, measured over the recent downswing from $98.41 to $60.13, at $79.27, strengthens the overhead barrier. To reinstate a steady recovery, SOL must clear $80.00 with a sustained breakout, potentially targeting the 78.6% Fibonacci retracement level at $90.21.
Momentum is mixed, with the Relative Strength Index (RSI) hovering around the neutral 50 mark and the Moving Average Convergence Divergence (MACD) marginally below the signal line, but the negative histogram contracts, hinting that bearish pressure is easing rather than decisively reversing.
On the downside, initial support is seen at the rising support trendline near $70.86. A break below there would open the way toward the 23.6% retracement at $69.16 and the prior cycle low region around $60.13.
(The technical analysis of this story was written with the help of an AI tool. Know more.)
Recommended Articles


