


Ethereum Price Forecast: Derivatives interest in ETH improves, but signs of caution remain
Ethereum price today: $1,880
- Ethereum shaved 3% off its market cap on Thursday following an increase in open interest and brief negative funding rate flip.
- Four consecutive days of inflows into US spot ETH ETFs indicate continued recovery in institutional demand, but spot sentiment in the region has yet to flip positive.
- ETH fails to clear the 100-day EMA overhead.
Ethereum (ETH) is hovering slightly below the $1,900 level, down 3% on Thursday following a slight expansion in derivatives interest.
The top altcoin's open interest has increased to 14.60 million ETH, marking a 600K ETH increase over the past two days and its highest level since June 7.
Open interest is the total worth of outstanding contracts in a derivatives market. Earlier in July, when ETH began its recovery, OI remained flat before the slight rise this week.
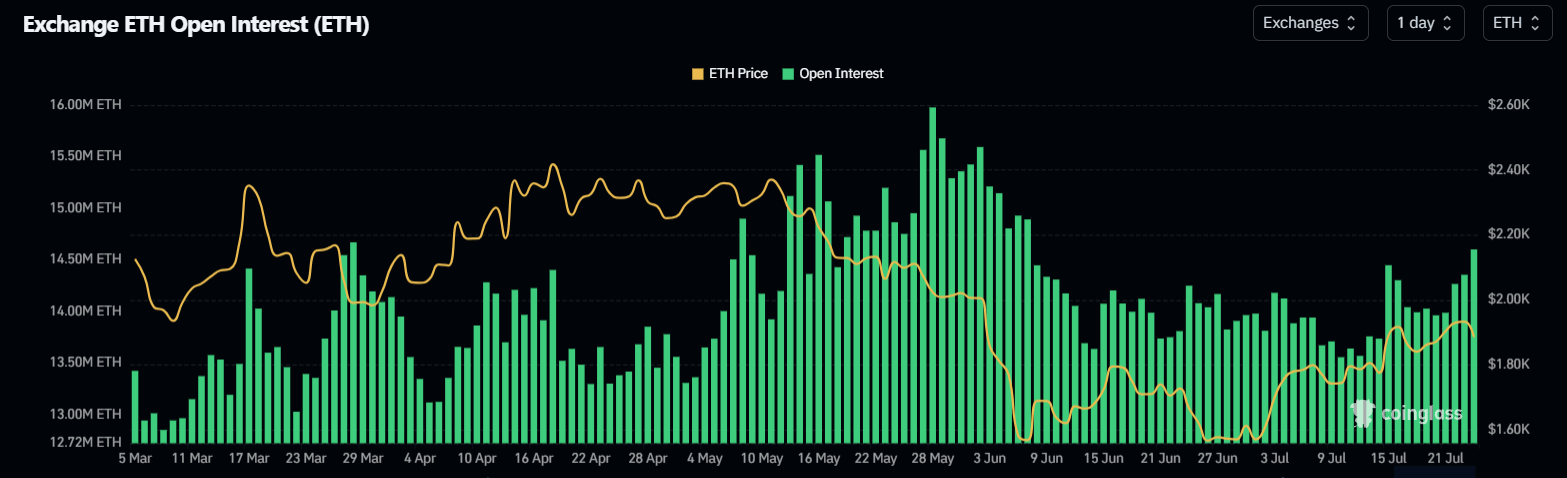
A similar trend is noticed in the Estimated Leverage Ratio (ELR), which has largely remained flat before a slight rise over the past week.
The ELR measures an asset's open interest compared to its exchange reserves to give a view of the amount of leverage traders are using relative to spot pressure.
-1784838729140.png)
Funding rates have also been largely positive throughout the month but have begun to ease this week and briefly flipped negative on Thursday, the first time since June 29. Funding rates are periodic payments between long and short traders in perpetual futures markets to keep a contract's price aligned with its underlying spot counterpart.
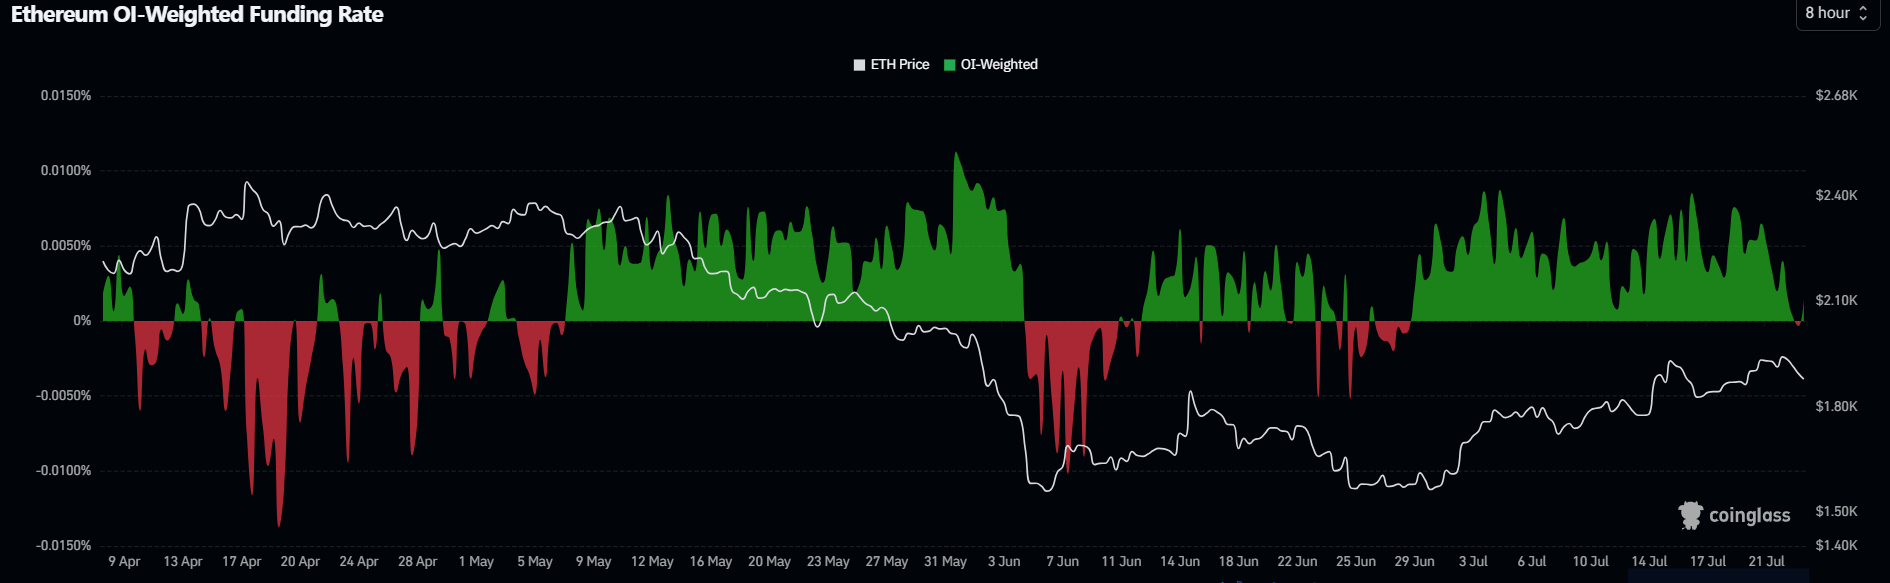
The returning leverage could help expand ETH's recent rise, but emerging signals of a negative flip in funding rates also bring a price squeeze into the picture.
Meanwhile, on the institutional side, US spot ETH exchange-traded funds (ETFs) continued their positive streak, recording $72.64 million in net inflows on Thursday, according to SoSoValue data. The move marks a fourth consecutive day of net inflows for the products.
While US institutional interest is recovering, spot traders' sentiment in the region has yet to flip positive. The Coinbase Premium Index, which tracks sentiment among traders in the region, has remained in negative territory for nearly three months. A sustained move into positive territory could spread bullish sentiment into other regions.
-1784838785144.png)
Ethereum Price Forecast: ETH falters before 100-day EMA again
Ethereum recorded $41.55 million in liquidations over the past 24 hours, led by $34.40 million in long liquidations, per Coinglass data.
On the daily chart, ETH is holding a constructive short-term tone as it remains above both the 20- and 50-day Exponential Moving Averages (EMAs) at $1,837 and $1,829. However, the upside remains challenged by a broader downtrend, with the 100-day EMA at $1,937 acting as a key overhead barrier, while momentum gauges remain supportive.
The Relative Strength Index (RSI) and Stochastic have eased toward 57 and 66, respectively, both hinting at steady but not extreme buying pressure.
On the topside, initial resistance emerges at the horizontal level of $1,909, ahead of the 100-day EMA at $1,937, with further bullish extension targeting $2,018 and then $2,107, where a denser supply zone begins toward $2,211 and $2,388.
On the downside, immediate support comes from the 20- and 50-day EMAs, followed by a more established floor at $1,806. A deeper pullback would expose $1,741, while only a break below $1,524 would seriously undermine the current constructive bias toward higher levels.
(The technical analysis of this story was written with the help of an AI tool. Know more.)
Recommended Articles


