


EUR/JPY extends rally as ECB hike buzz tests Yen risks
- Lagarde flags upside inflation risks while avoiding rate-path commitments.
- Yen losses remain limited as intervention fears shadow EUR/JPY upside.
- Japan CPI, Jibun PMIs and Eurozone PMIs guide cross.
The EUR/JPY extends its advance for the third straight day, set to end the week with solid gains as traders brace for the end of the week. The shared currency didn’t capitalise on the hawkish forward guidance by the European Central Bank (ECB), as Bloomberg, citing sources, revealed that officials are ready to raise rates in September.
Euro gains as ECB hawkishness offsets BoJ intervention caution
Digging into ECB President Christine Lagarde’s press conference, she said that inflation risks are tilted to the upside and growth to the downside, but stated that the central bank would set monetary policy to ensure that inflation returns to the 2% goal in the medium term. She added that they would remain data-dependent and would not pre-commit to an interest rate path.
Meanwhile, the Japanese Yen weakened less than expected against the Euro as investors remain wary that the Bank of Japan (BoJ) might intervene in the foreign exchange markets to push its local currency.
On Friday, EUR/JPY traders will be watching the release of Japanese inflation data. The National CPI excluding Fresh Food is expected to rise from 1.4% to 1.6% YoY. Also, traders would be looking for updates on Jibun Bank Flash PMIs, with the manufacturing activity index measure expected to ease from 54.8 to 54.5.
In the Eurozone, traders will also digest HCOB Flash PMIs for Germany, France, and the European Union (EU). The EU’s HCOB Manufacturing PMI is expected to drop from 51.4 to 51.3, while the Services PMI is expected to improve, but will remain in contractionary territory, from 49.4 to 49.8.
EUR/JPY Price Forecast: Technical outlook
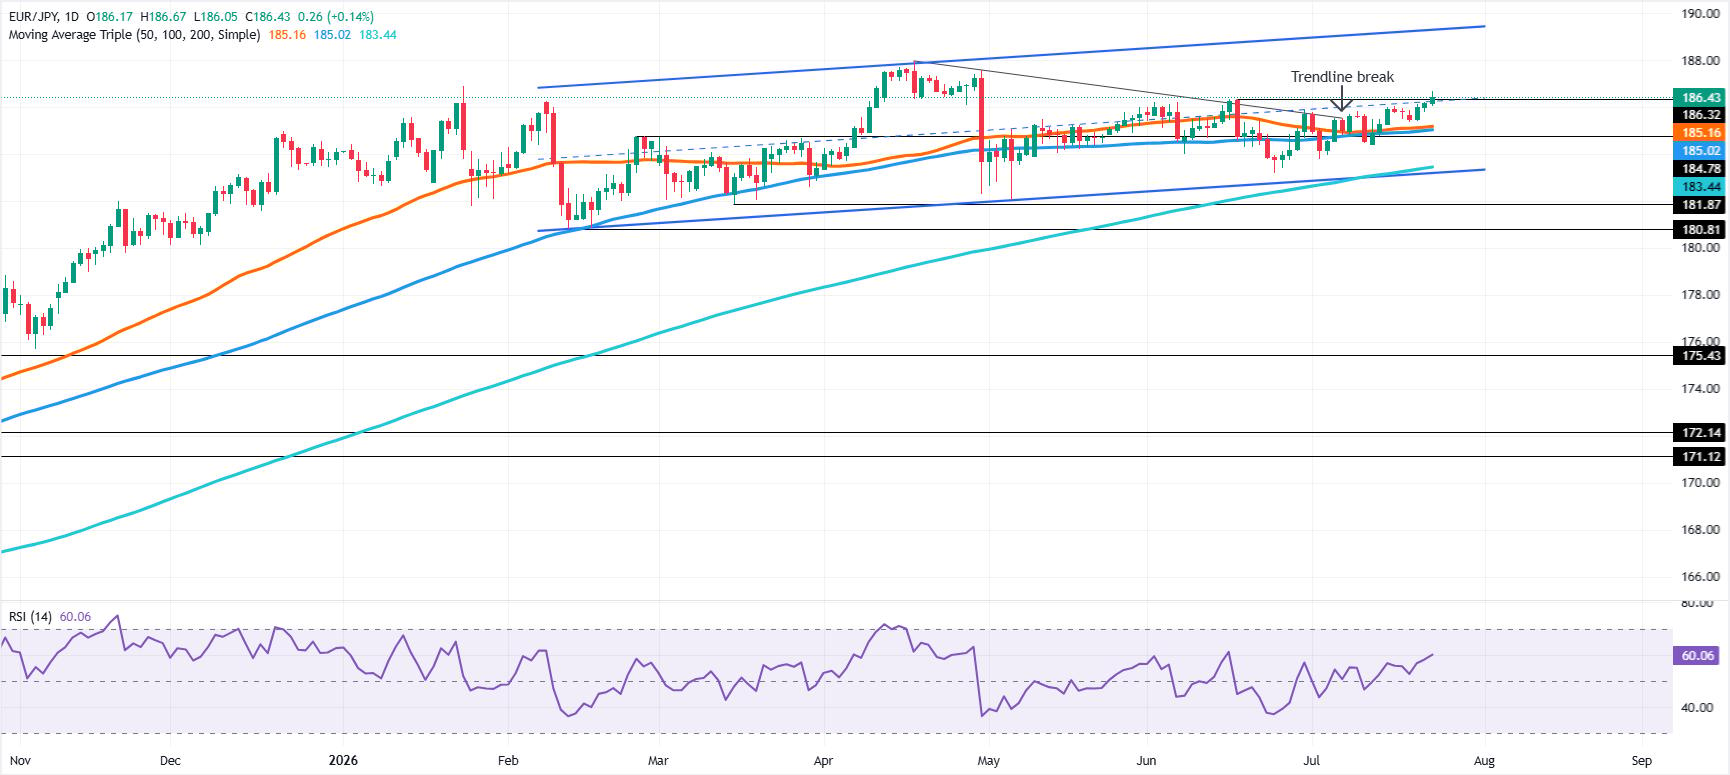
The EUR/JPY daily chart shows that momentum is tilted to the upside, further confirmed by a rising Relative Strength Index (RSI). Additionally, a trendline break since last week shifted the market structure from sideways trading to an uptrend, as prices drift higher at a modest pace.
For a bullish continuation, the EUR/JPY needs to clear the April 30, high at 187.56, before buyers can eye 187.95, the year-to-date (YTD) high. Above lies the psychological 188.00 and 190.00 levels.
On the downside, sellers could trigger a break of the market structure, but first they need to clear Thursday’s low of the day (LOD) at 186.05. Once done, they could test the confluence of the 50 and 100-day SMAs at 185.16/02, before targeting the 200-day SMA at 183.44.
EUR/JPY Price Chart – Daily
Japanese Yen Price This week
The table below shows the percentage change of Japanese Yen (JPY) against listed major currencies this week. Japanese Yen was the strongest against the Swiss Franc.
| USD | EUR | GBP | JPY | CAD | AUD | NZD | CHF | |
|---|---|---|---|---|---|---|---|---|
| USD | 0.43% | 1.03% | 0.92% | 0.48% | -0.03% | 1.08% | 1.01% | |
| EUR | -0.43% | 0.61% | 0.43% | 0.07% | -0.43% | 0.65% | 0.58% | |
| GBP | -1.03% | -0.61% | -0.17% | -0.54% | -1.03% | 0.03% | 0.02% | |
| JPY | -0.92% | -0.43% | 0.17% | -0.36% | -0.90% | 0.11% | 0.20% | |
| CAD | -0.48% | -0.07% | 0.54% | 0.36% | -0.47% | 0.46% | 0.58% | |
| AUD | 0.03% | 0.43% | 1.03% | 0.90% | 0.47% | 1.11% | 1.07% | |
| NZD | -1.08% | -0.65% | -0.03% | -0.11% | -0.46% | -1.11% | -0.02% | |
| CHF | -1.01% | -0.58% | -0.02% | -0.20% | -0.58% | -1.07% | 0.02% |
The heat map shows percentage changes of major currencies against each other. The base currency is picked from the left column, while the quote currency is picked from the top row. For example, if you pick the Japanese Yen from the left column and move along the horizontal line to the US Dollar, the percentage change displayed in the box will represent JPY (base)/USD (quote).
Recommended Articles


