


Top Altcoins Price Forecast: XRP and ADA rebound as DOGE lags behind
- XRP extends gains on Tuesday for the fifth consecutive day, inching closer to its 50-day EMA at $1.14.
- Dogecoin maintains a consolidative tone on Tuesday, holding above the crucial support level at $0.0700.
- Cardano extends gains on Tuesday as bullish momentum resurfaces.
The broader cryptocurrency market shows early signs of a bullish recovery, with Bitcoin (BTC) rising above $65,000 on Tuesday, amid improving retail sentiment. Top altcoins, including Ripple (XRP) and Cardano (ADA), are gaining bullish momentum, while Dogecoin (DOGE) continues to consolidate, holding above a crucial support zone.
Ripple regains bullish momentum
XRP remains below both the 50-day and 200-day Exponential Moving Averages (EMAs) at $1.1456 and $1.4678, respectively, keeping the pair in a capped, mildly bearish near-term structure. A decisive close above the 50-day EMA at $1.1456 could ease the current downside bias, ahead of a more substantial barrier at the $1.2543 to $1.2700 supply zone.
Momentum, however, is more constructive than price action suggests, with the Moving Average Convergence Divergence (MACD) and its signal line maintaining an upward trend, suggesting a bullish profile. Meanwhile, the Relative Strength Index (RSI) around 53 points to steady, non-overbought conditions that could support further recovery.
On the downside, the recent reaction low zone just below the $1.0000 psychological support becomes the next area to watch, as a decisive move below it would likely invite renewed selling pressure.
Cardano extends gains toward its 50-day EMA
Cardano holds above $0.1700 at press time on Tuesday, extending the previous day's gains. However, the altcoin remains below both the 50-day EMA at $0.1772 and the 200-day EMA at $0.2882, which keeps the broader tone bearish.
The MACD rises above its signal line after a minor consolidation, rebuilding a positive histogram profile, while the RSI at 53 hints at modest recovery momentum, yet the pair remains capped by the nearby 50-day EMA overhead.
Looking up, if ADA clears above $0.1772, the potential breakout rally could target the support-turned-resistance level at $0.2205.
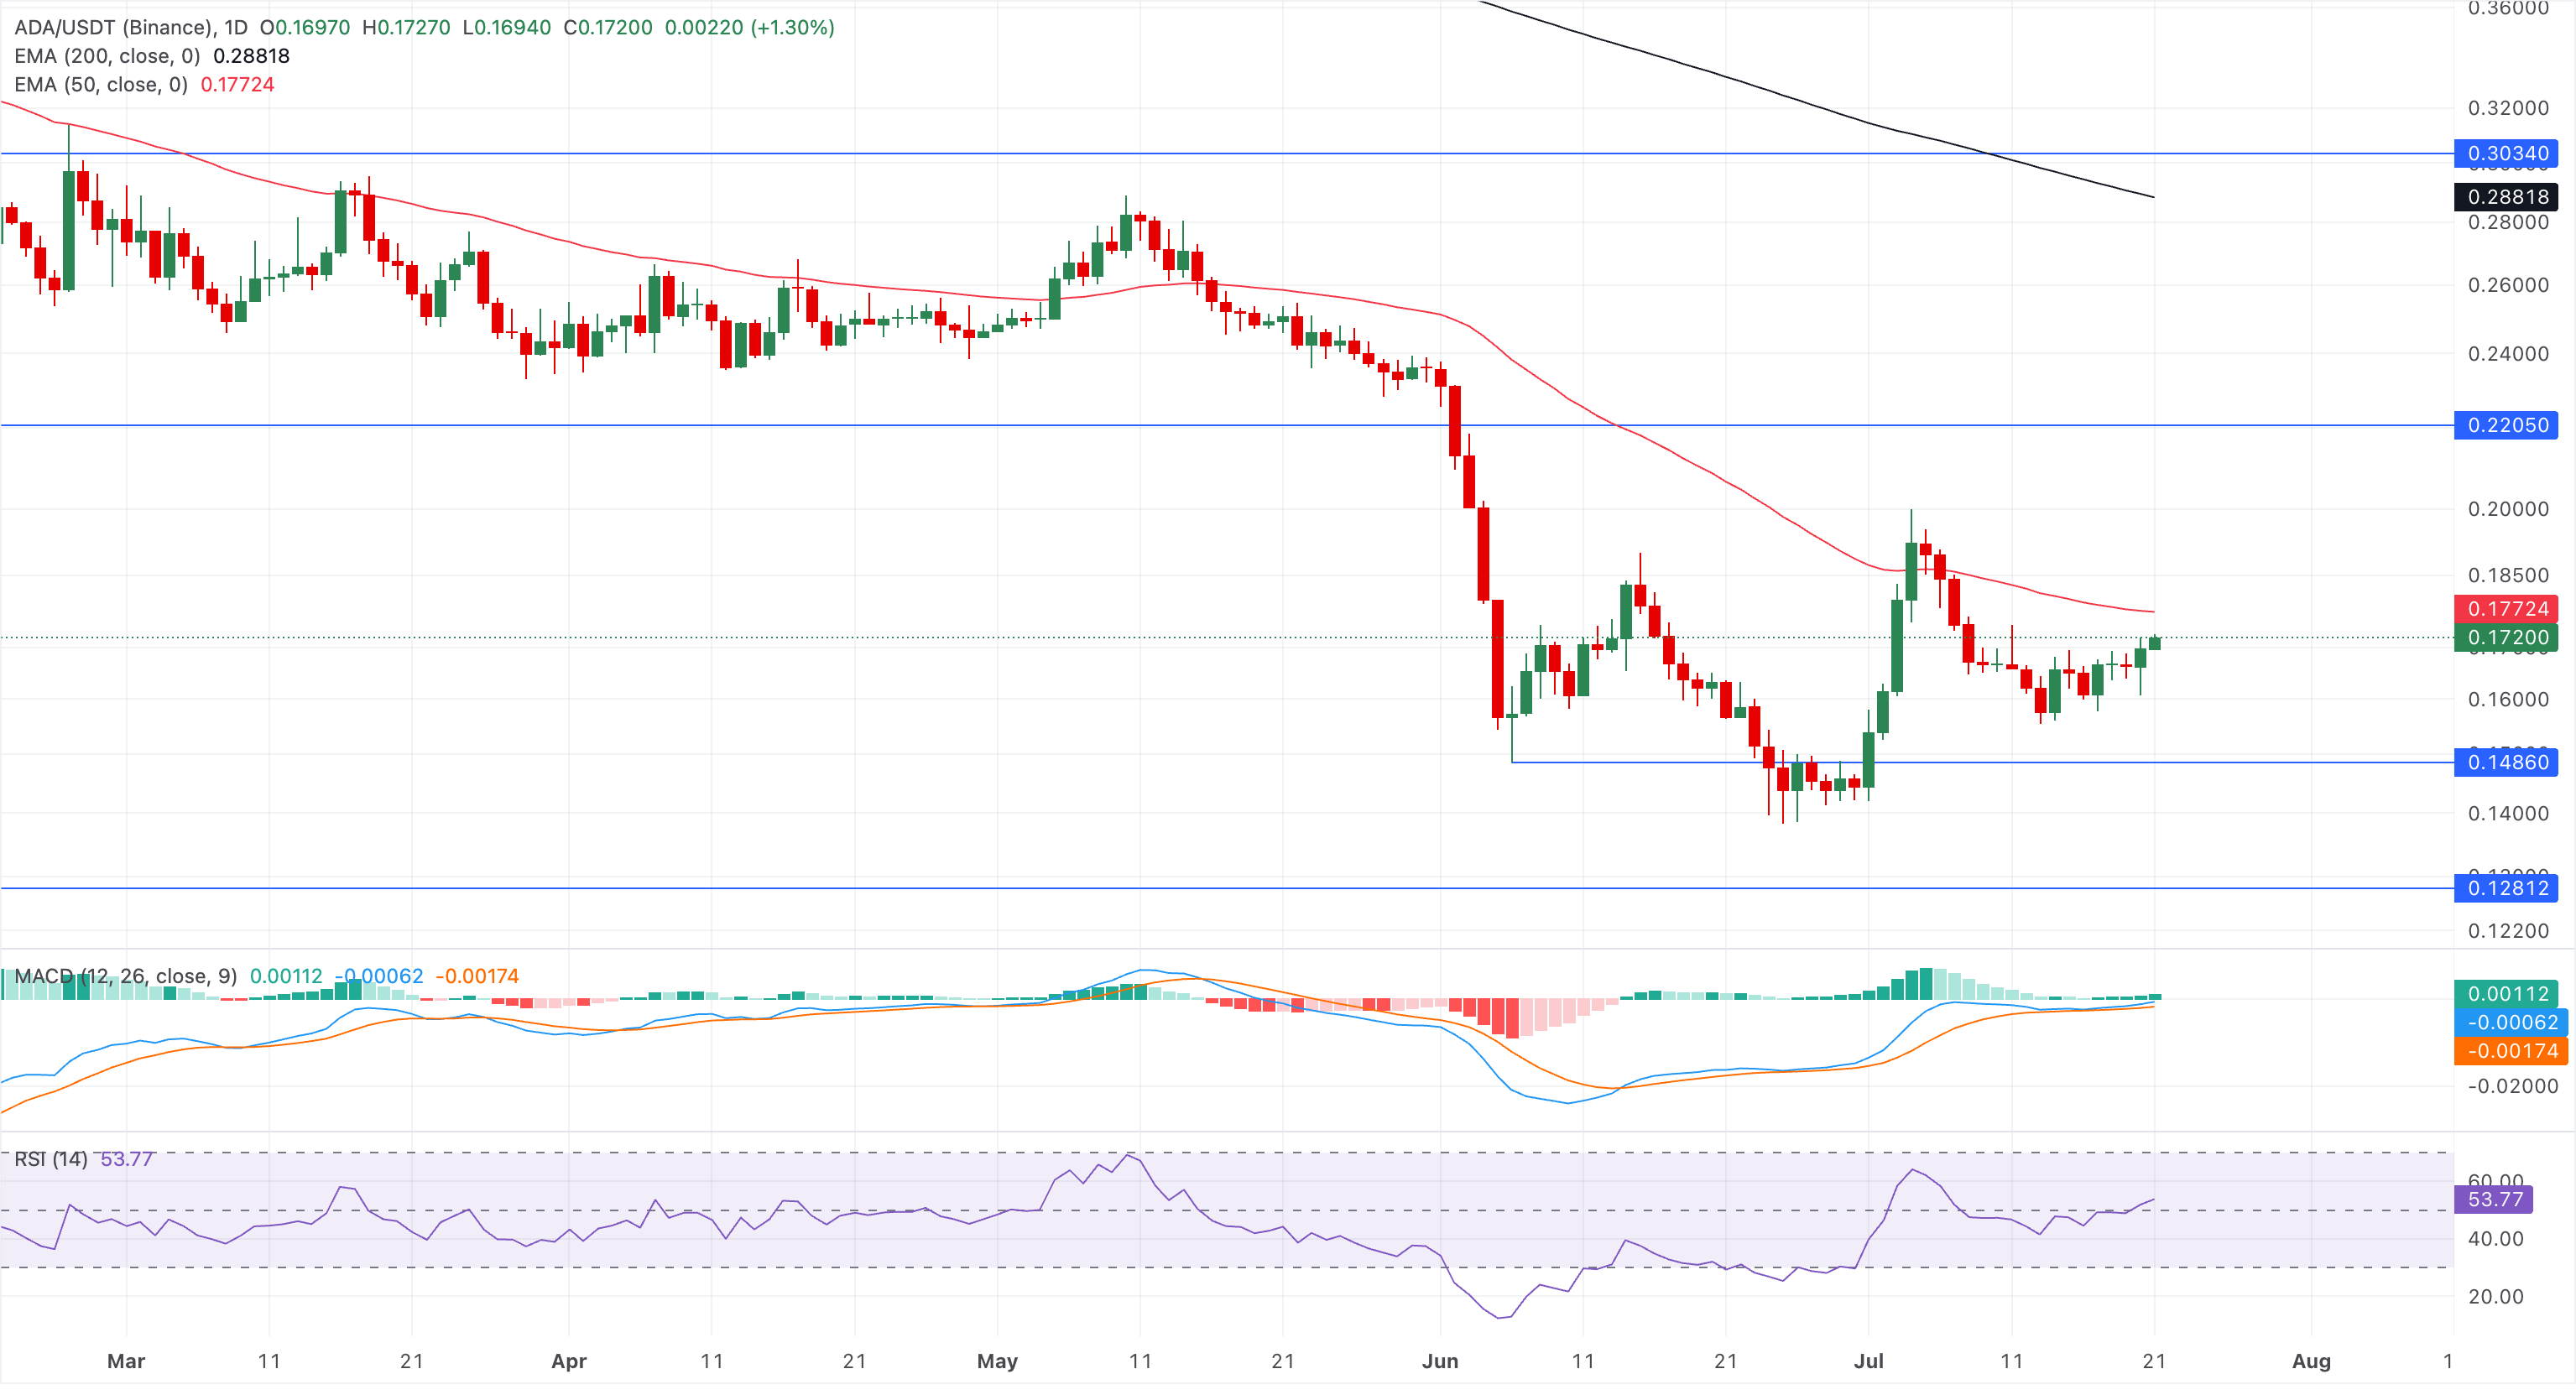
Looking down, the key structural floor is the horizontal support at $0.1486, which marks the initial bearish target if selling pressure resumes.
Dogecoin consolidates near key support level
Dogecoin maintains a bearish near‑term bias as it stays below the 50‑day EMA at $0.0798 and the 200‑day EMA at $0.1040. The meme coin is consolidating just above the $0.0700 handle after failing to hold the prior horizontal resistance at $0.0777.
The RSI at 39 hints at subdued but stabilizing downside momentum, and the MACD line hovering slightly above its signal line suggests modest bullish attempts within an overall capped structure.
Immediate resistance appears at $0.0777, followed by the 50‑day EMA at $0.0798; only a sustained break above these levels would ease selling pressure and expose the next key barrier at $0.0879.
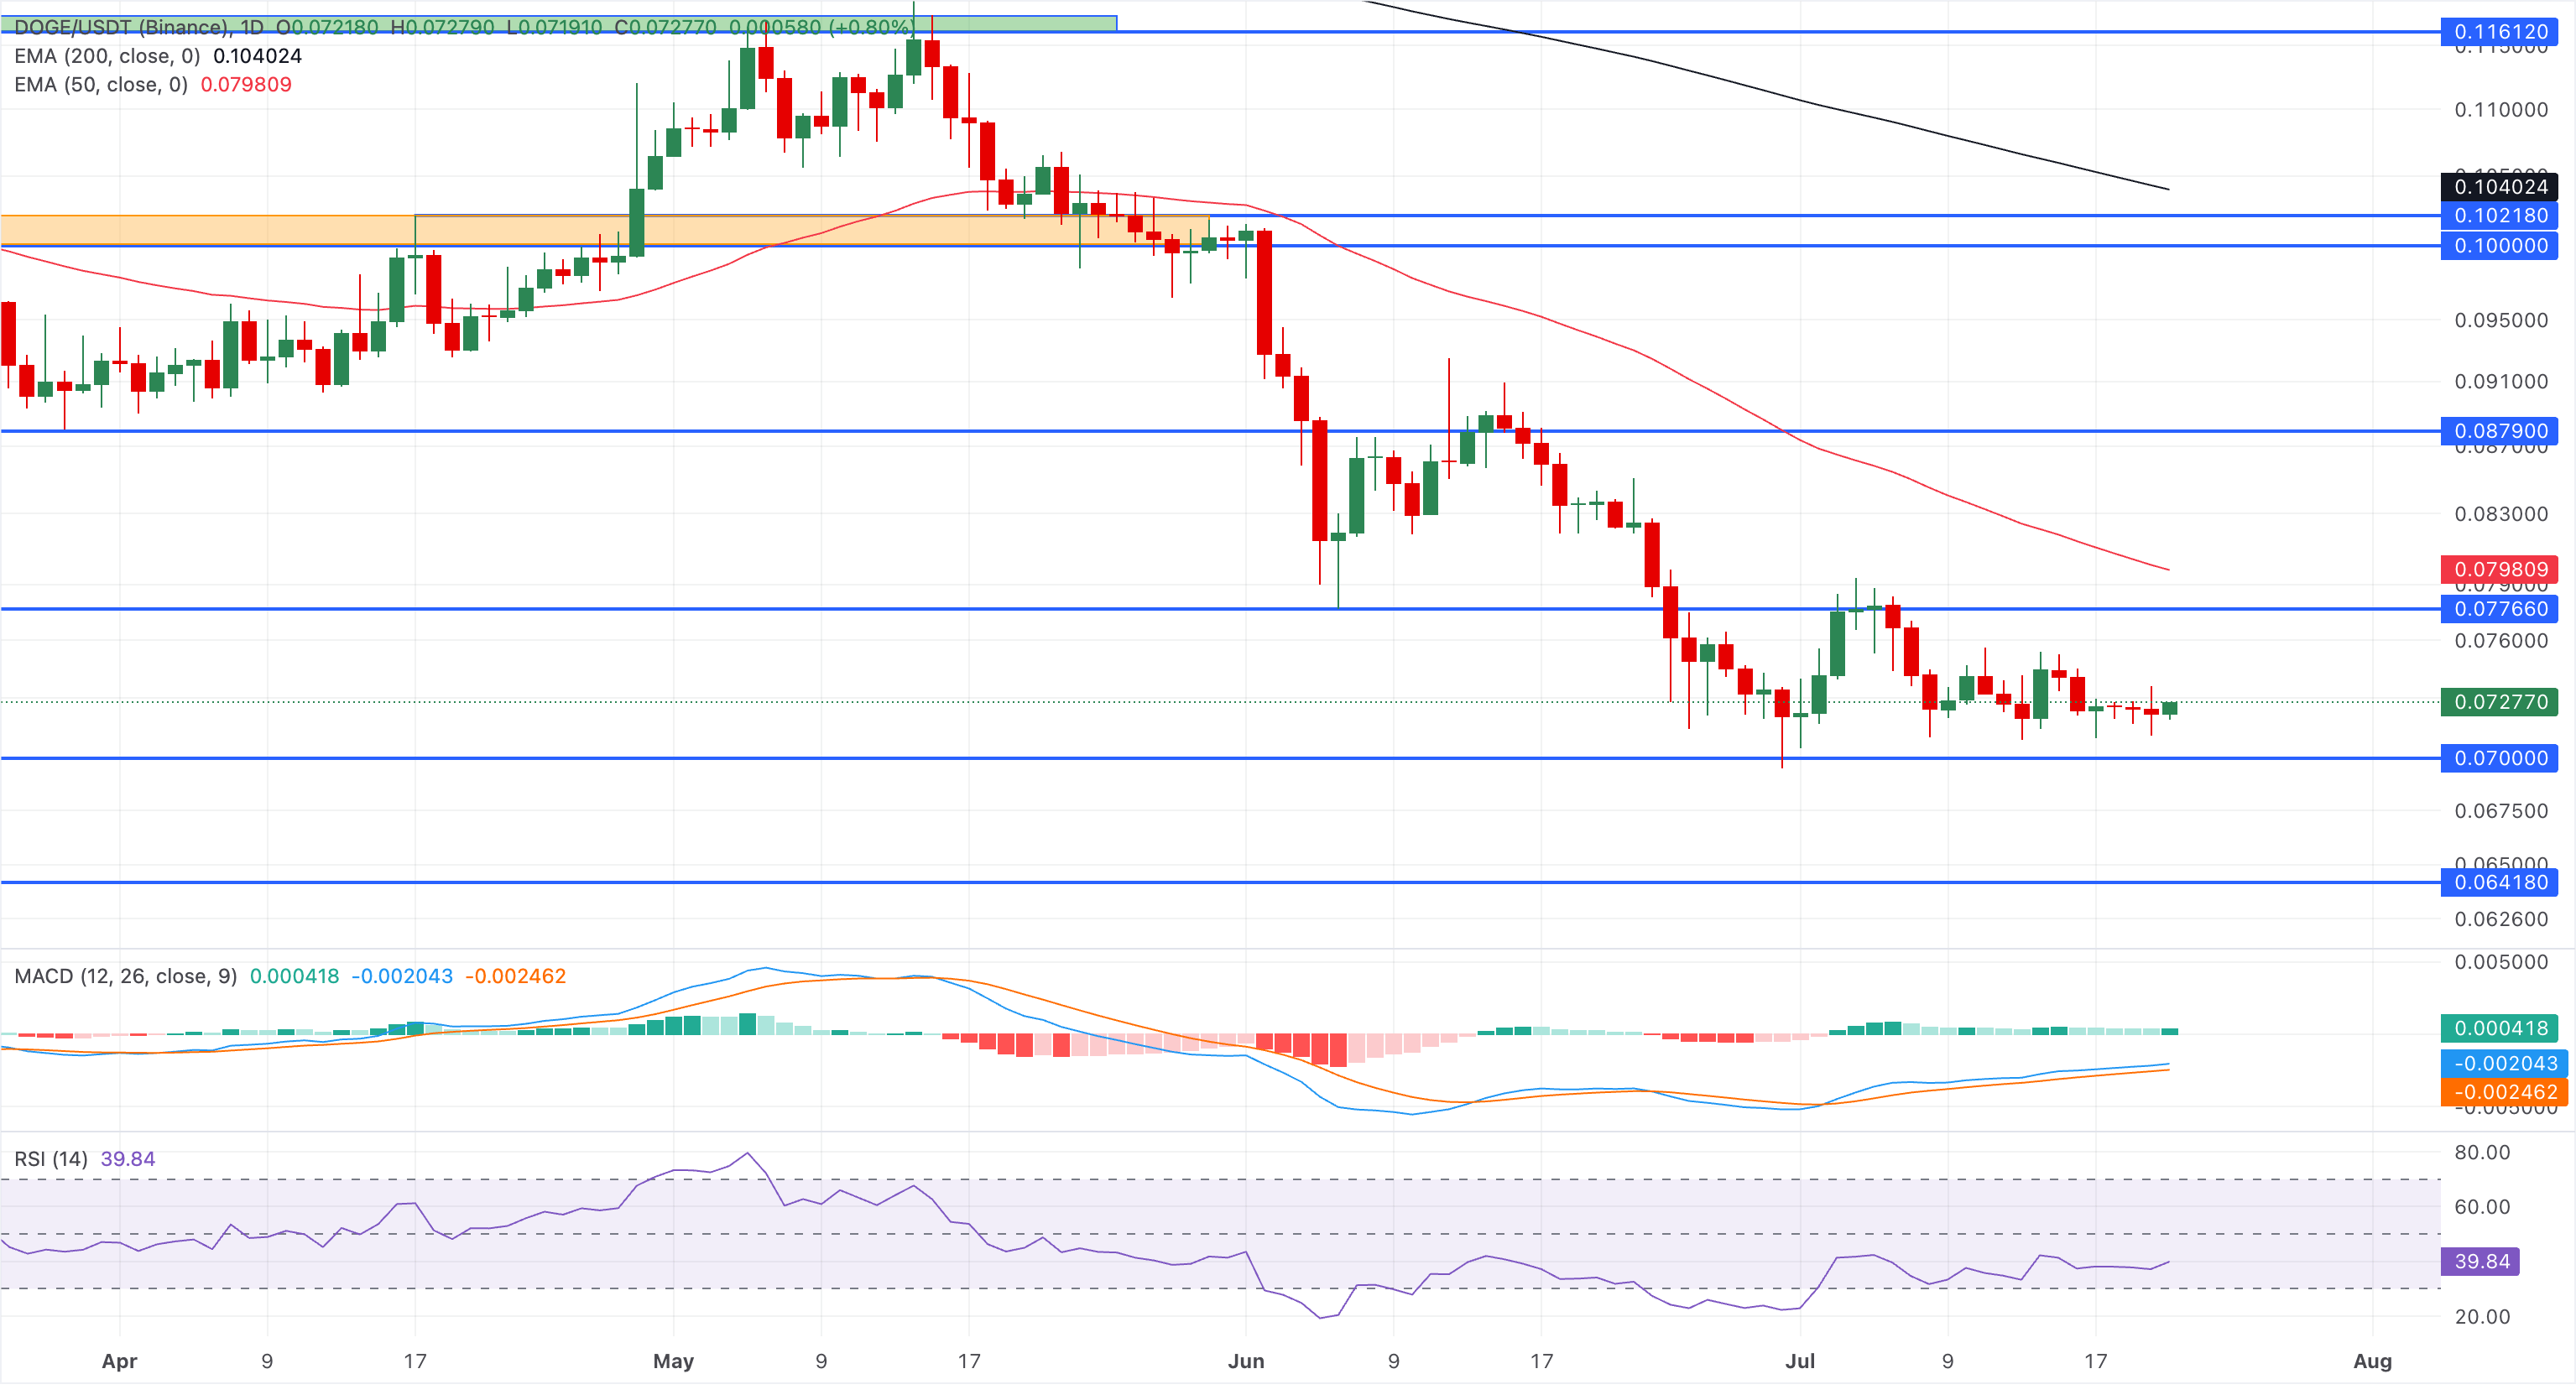
Initial support is seen at $0.0700, where a daily close would likely extend the bearish phase toward $0.0642.
(The technical analysis of this story was written with the help of an AI tool. Know more.)
Recommended Articles


