


Crypto Market Overview: Bitcoin reclaims $65,000 – VIRTUAL, UNI hold gains
- Bitcoin hovers above $65,000 on Tuesday as bullish momentum recovers.
- Crypto market risk-off sentiment eases to a neutral level, increasing the odds of extended recovery.
- Virtuals Protocol and Uniswap have emerged as top performers over the last 24 hours.
Bitcoin (BTC) edges above $65,000 on Tuesday, following the breakout of the 50-day Exponential Moving Average (EMA) at $65,051 the previous day. Easing crypto market risk-off sentiment provides tailwinds for altcoins, supporting an extended recovery. Virtuals Protocol (VIRTUAL) and Uniswap (UNI) have emerged as top performers over the last 24 hours.
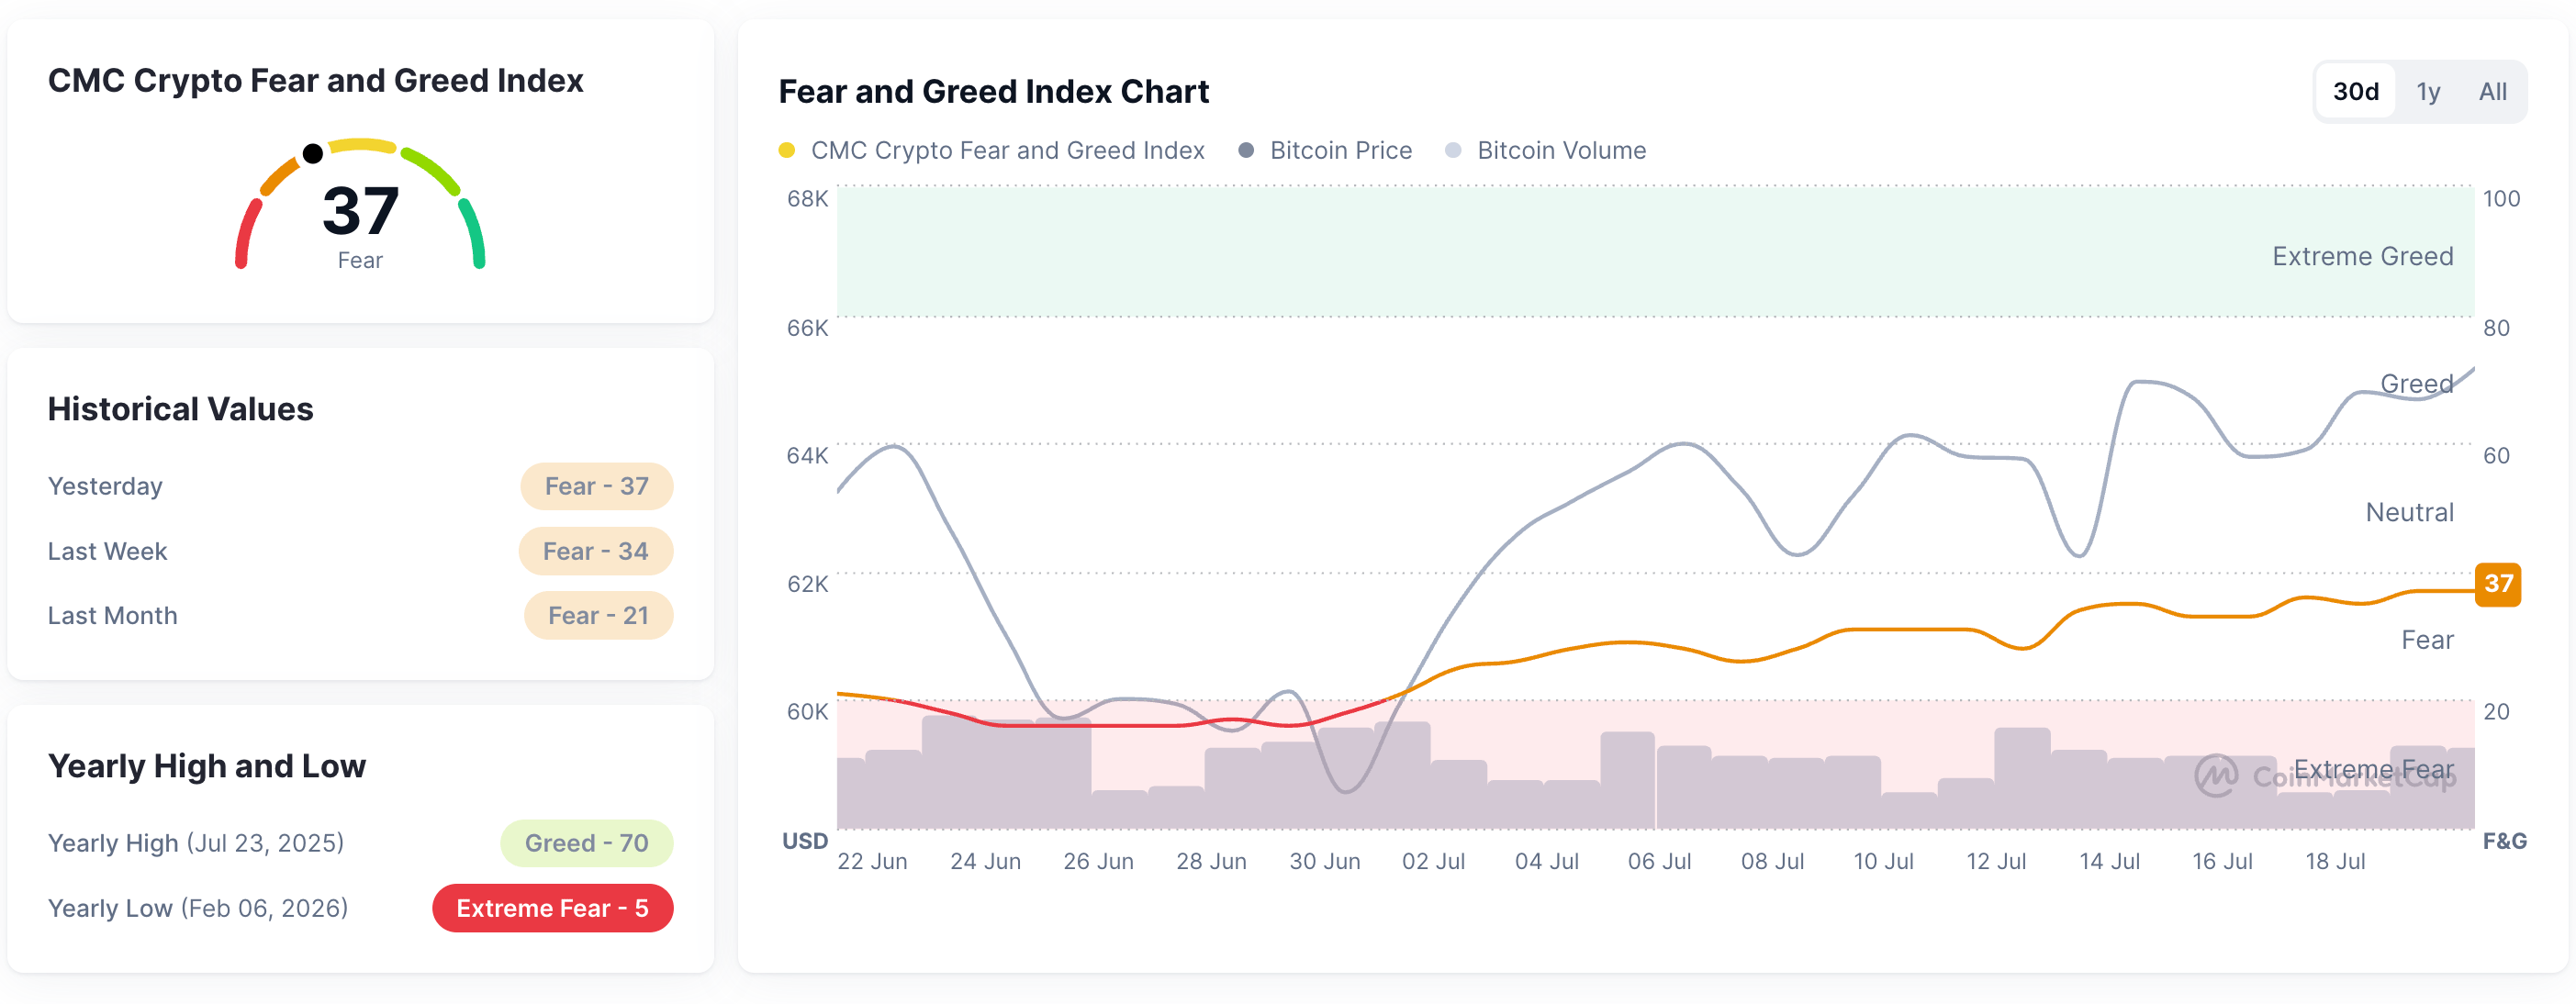
CoinMarketCap’s Fear and Greed Index at 37 indicates a steady recovery in market sentiment, suggesting improving investor confidence.
Bitcoin extends gains above $65,000
Bitcoin holds above the 50-day EMA at $65,051 but remains well below the 200-day EMA at $74,693, which continues to cap the broader trend. This alignment suggests a neutral-to-mildly constructive near-term bias, with the recent recovery supported by the short-term EMA, while the longer-term gauge serves as a distant ceiling.
Momentum is positive, as the Relative Strength Index (RSI) hovers near 57 and the Moving Average Convergence Divergence (MACD) ascends above the zero line, hinting that buyers retain an advantage but face a heavy higher-timeframe barrier.
On the topside, initial resistance is at the $70,000 mark, with a subsequent hurdle aligning near the 200-day EMA at $74,693, where supply could intensify.
On the downside, immediate support is seen at the 50-day EMA at $65,051, and a deeper pullback would expose the horizontal floor at $60,000, a psychologically important level that previously underpinned the broader structure.
Virtuals Protocol and Uniswap gain bullish momentum
Virtuals Protocol extends gains on Tuesday, following a 4% surge the previous day. VIRTUAL token holds above the 50-day EMA at $0.6083, reinforcing a constructive near-term bias.
From a technical perspective, the recovery is heading toward the 50% retracement at $0.7426, measured from $1.1984 to $0.4602. Momentum supports the bullish tone, with the RSI hovering near 61 and MACD in positive territory, suggesting ongoing upside pressure.
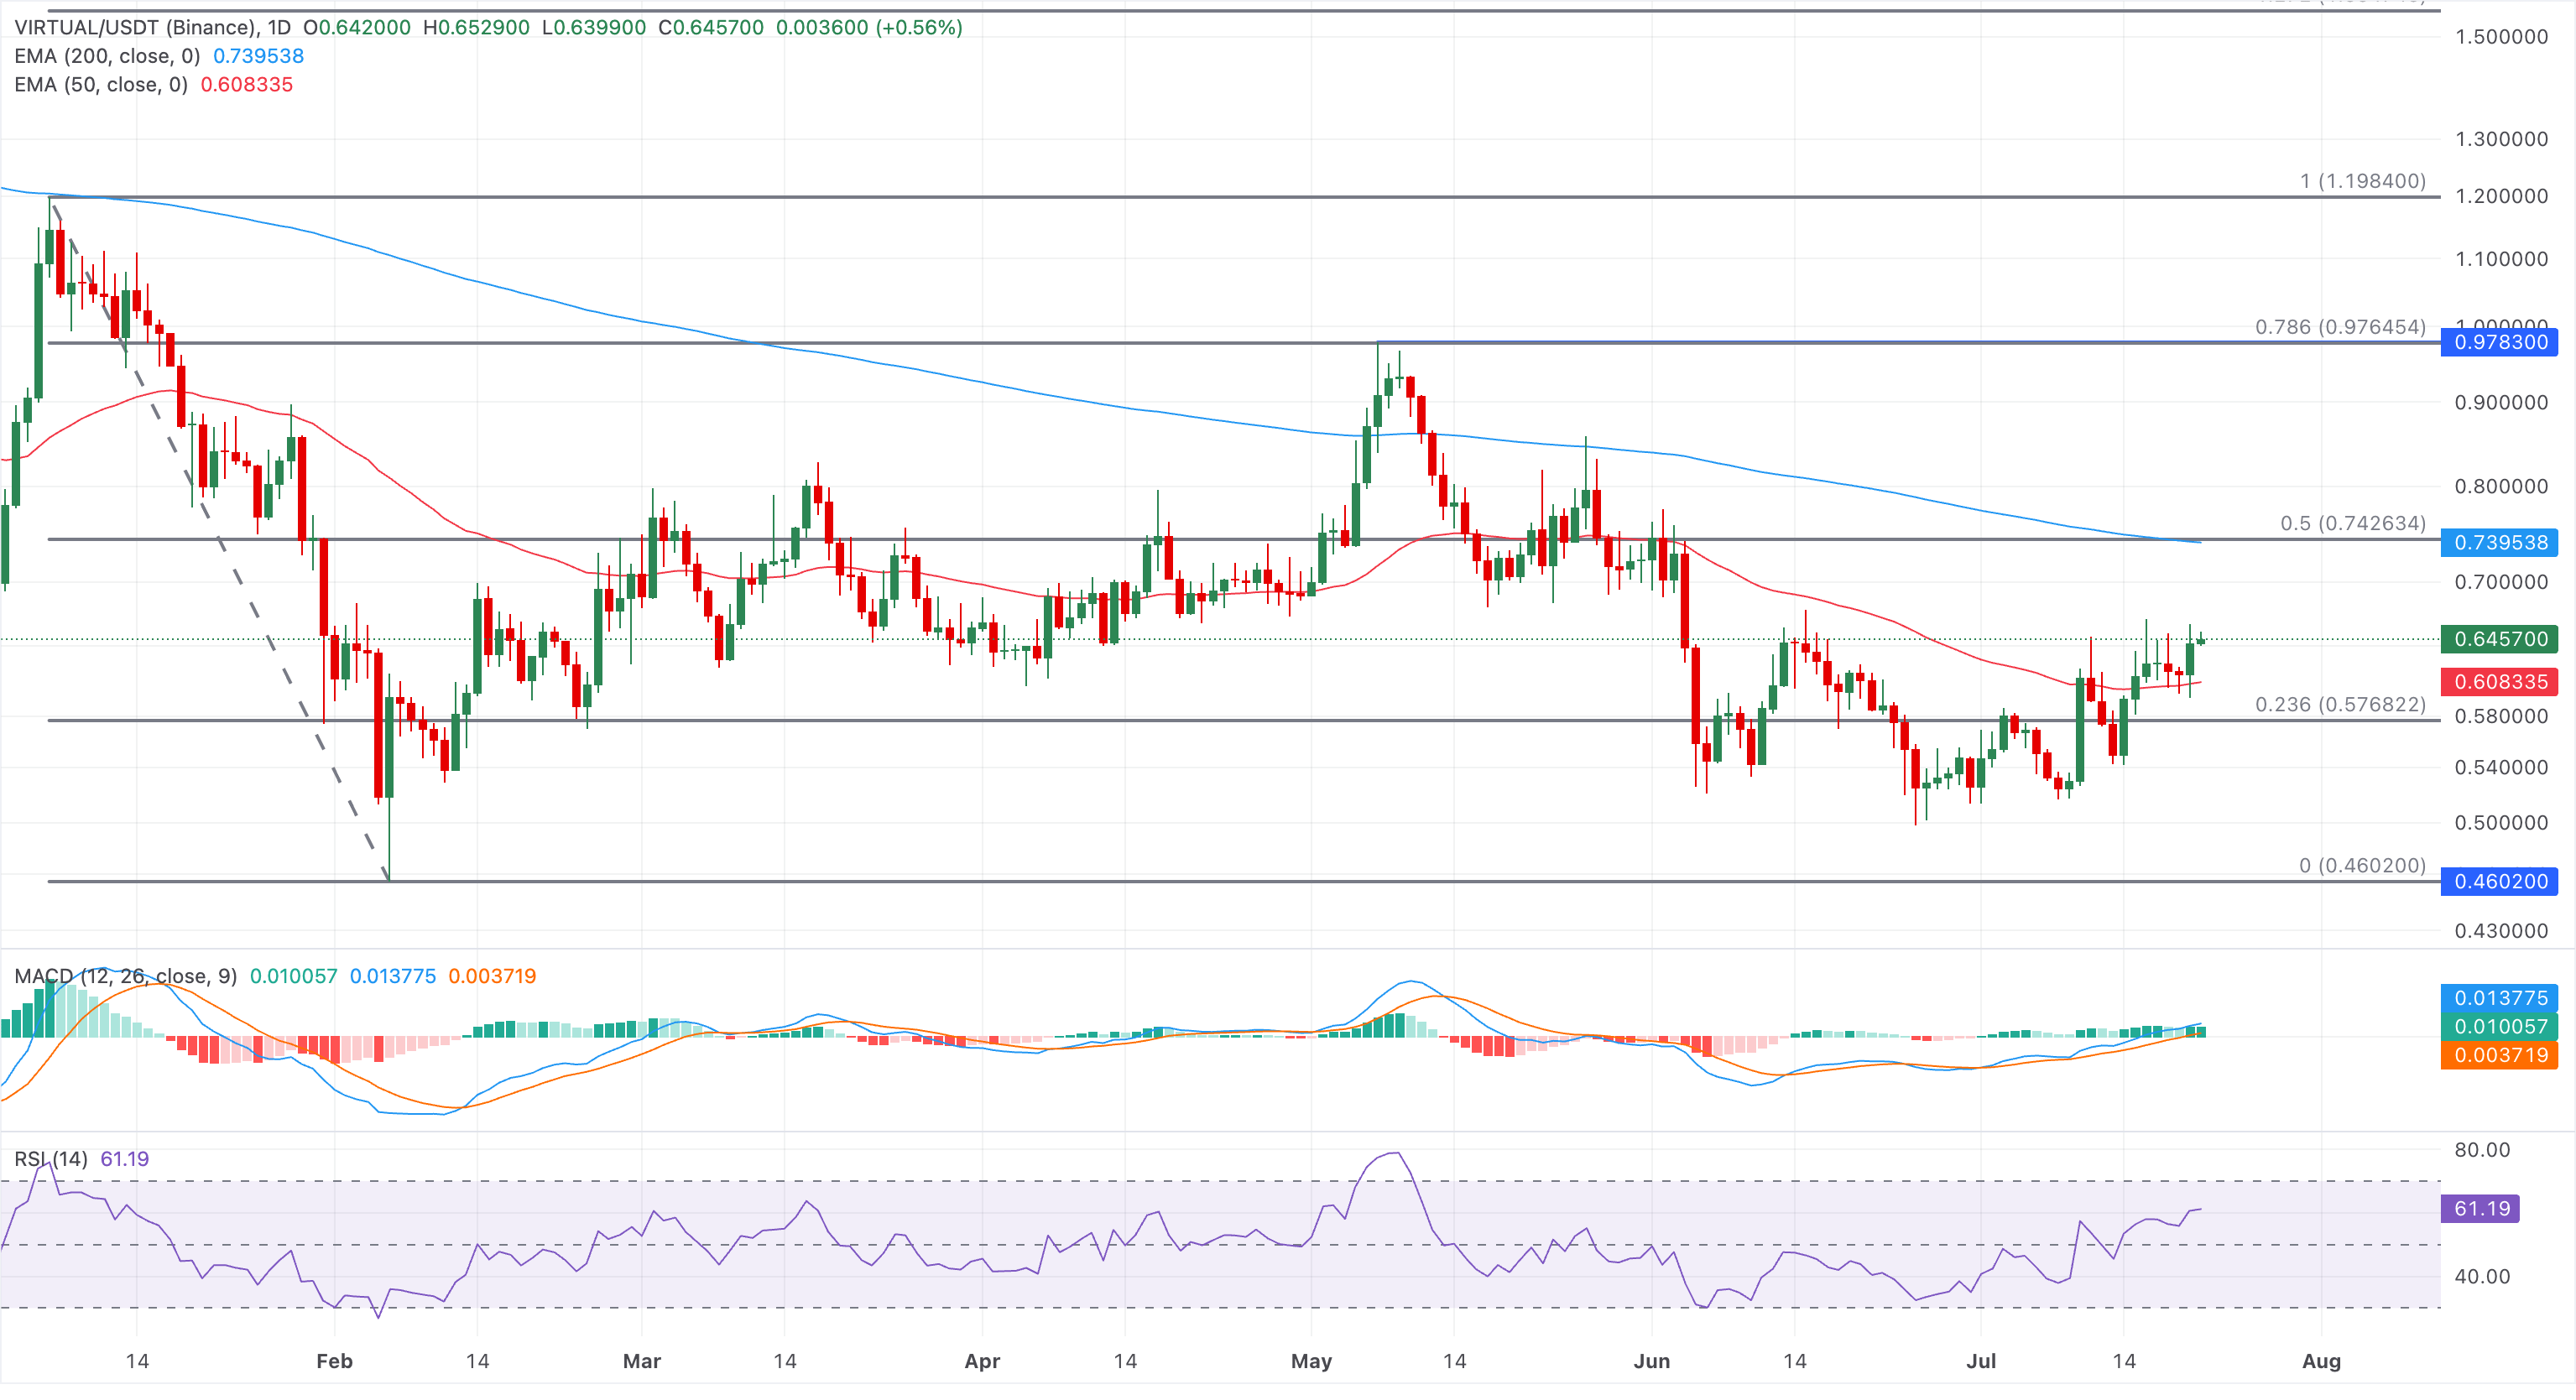
On the downside, initial support is located around the 50-day EMA at $0.6083; a break below this cluster would expose the structural floor near the 23.6% Fibonacci level at $0.5768.
Uniswap maintains a constructive bullish bias as price holds above the 50-day EMA at $3.2688. The DeFi token tests the 78.6% Fibonacci retracement, measured from $4.1700 to $2.3160, at $3.6769. A decisive close above this level could face an overhead barrier at the 200-day EMA at $3.8672, followed by the Fibonacci anchor at $4.1700.
The RSI at 64 stays in positive territory without reaching overbought, while the MACD hovers just above zero with a flattening profile, suggesting bullish momentum is still present but losing some intensity.
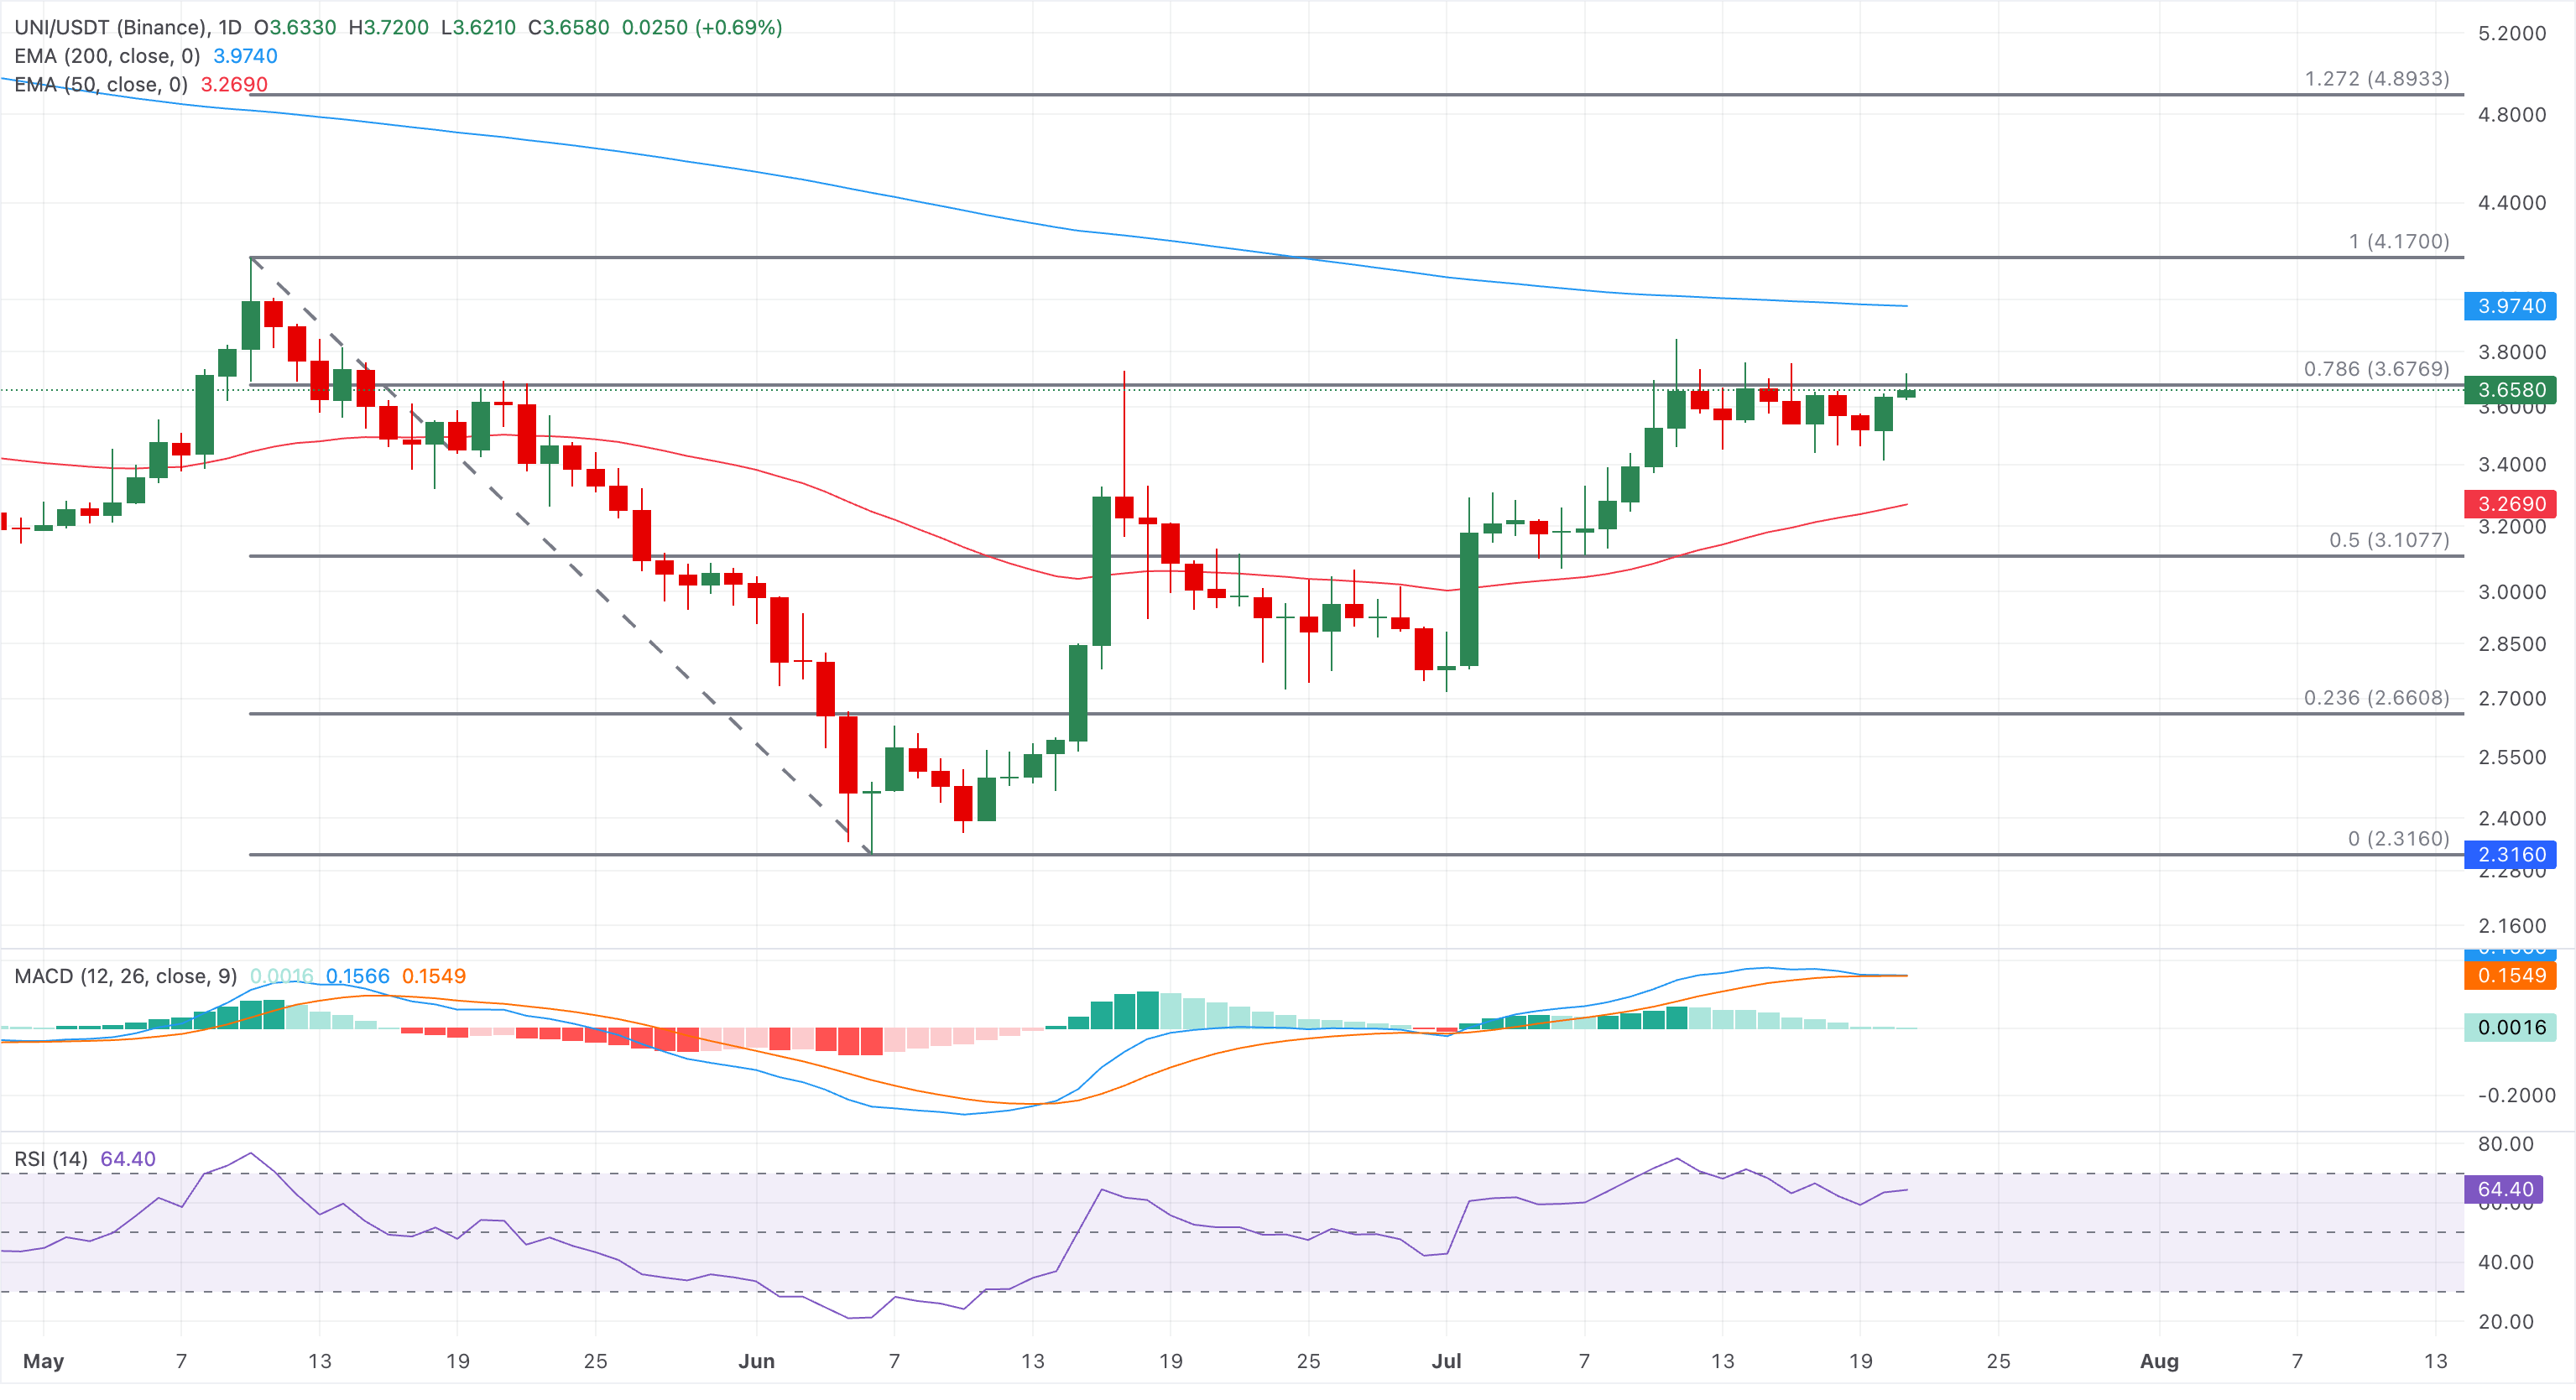
On the downside, initial support is located at the 50-day EMA at $3.2688 and the 50% retracement at $3.1077.
(The technical analysis of this story was written with the help of an AI tool. Know more.)
Recommended Articles


