

Zcash Price Forecast: ZEC maintains bullish structure above key retracement support

Source Fxstreet
  • Zcash edges higher on Friday, holding above $500 after an 8% drop the previous day.
  • Derivatives data indicates mixed retail sentiment, with Open Interest contracts contracting, while a positive funding rate spike suggests bullish demand.
  • The technical outlook for Zcash is bullish, as the structural uptrend remains intact above a key retracement support level.

Zcash (ZEC) is up over 2% on Friday, recovering from an 8% decline the previous day. The privacy coin maintains its retail strength with a rising funding rate despite a minor contraction in ZEC futures Open Interest. Technically, ZEC retains a structural upward trend above its crucial moving averages with an upside toward $690.

Retail support holds amid minor pullback

CoinGlass data shows the ZEC futures Open Interest (OI) dropped over 5% in the last 24 hours to $1.10 billion, reflecting a contraction in active perpetual contracts, which aligns with Thursday’s pullback. However, the surge in funding rate to 0.0228%, from 0.0100% the previous day, reflects a buy-the-dip approach among traders. 
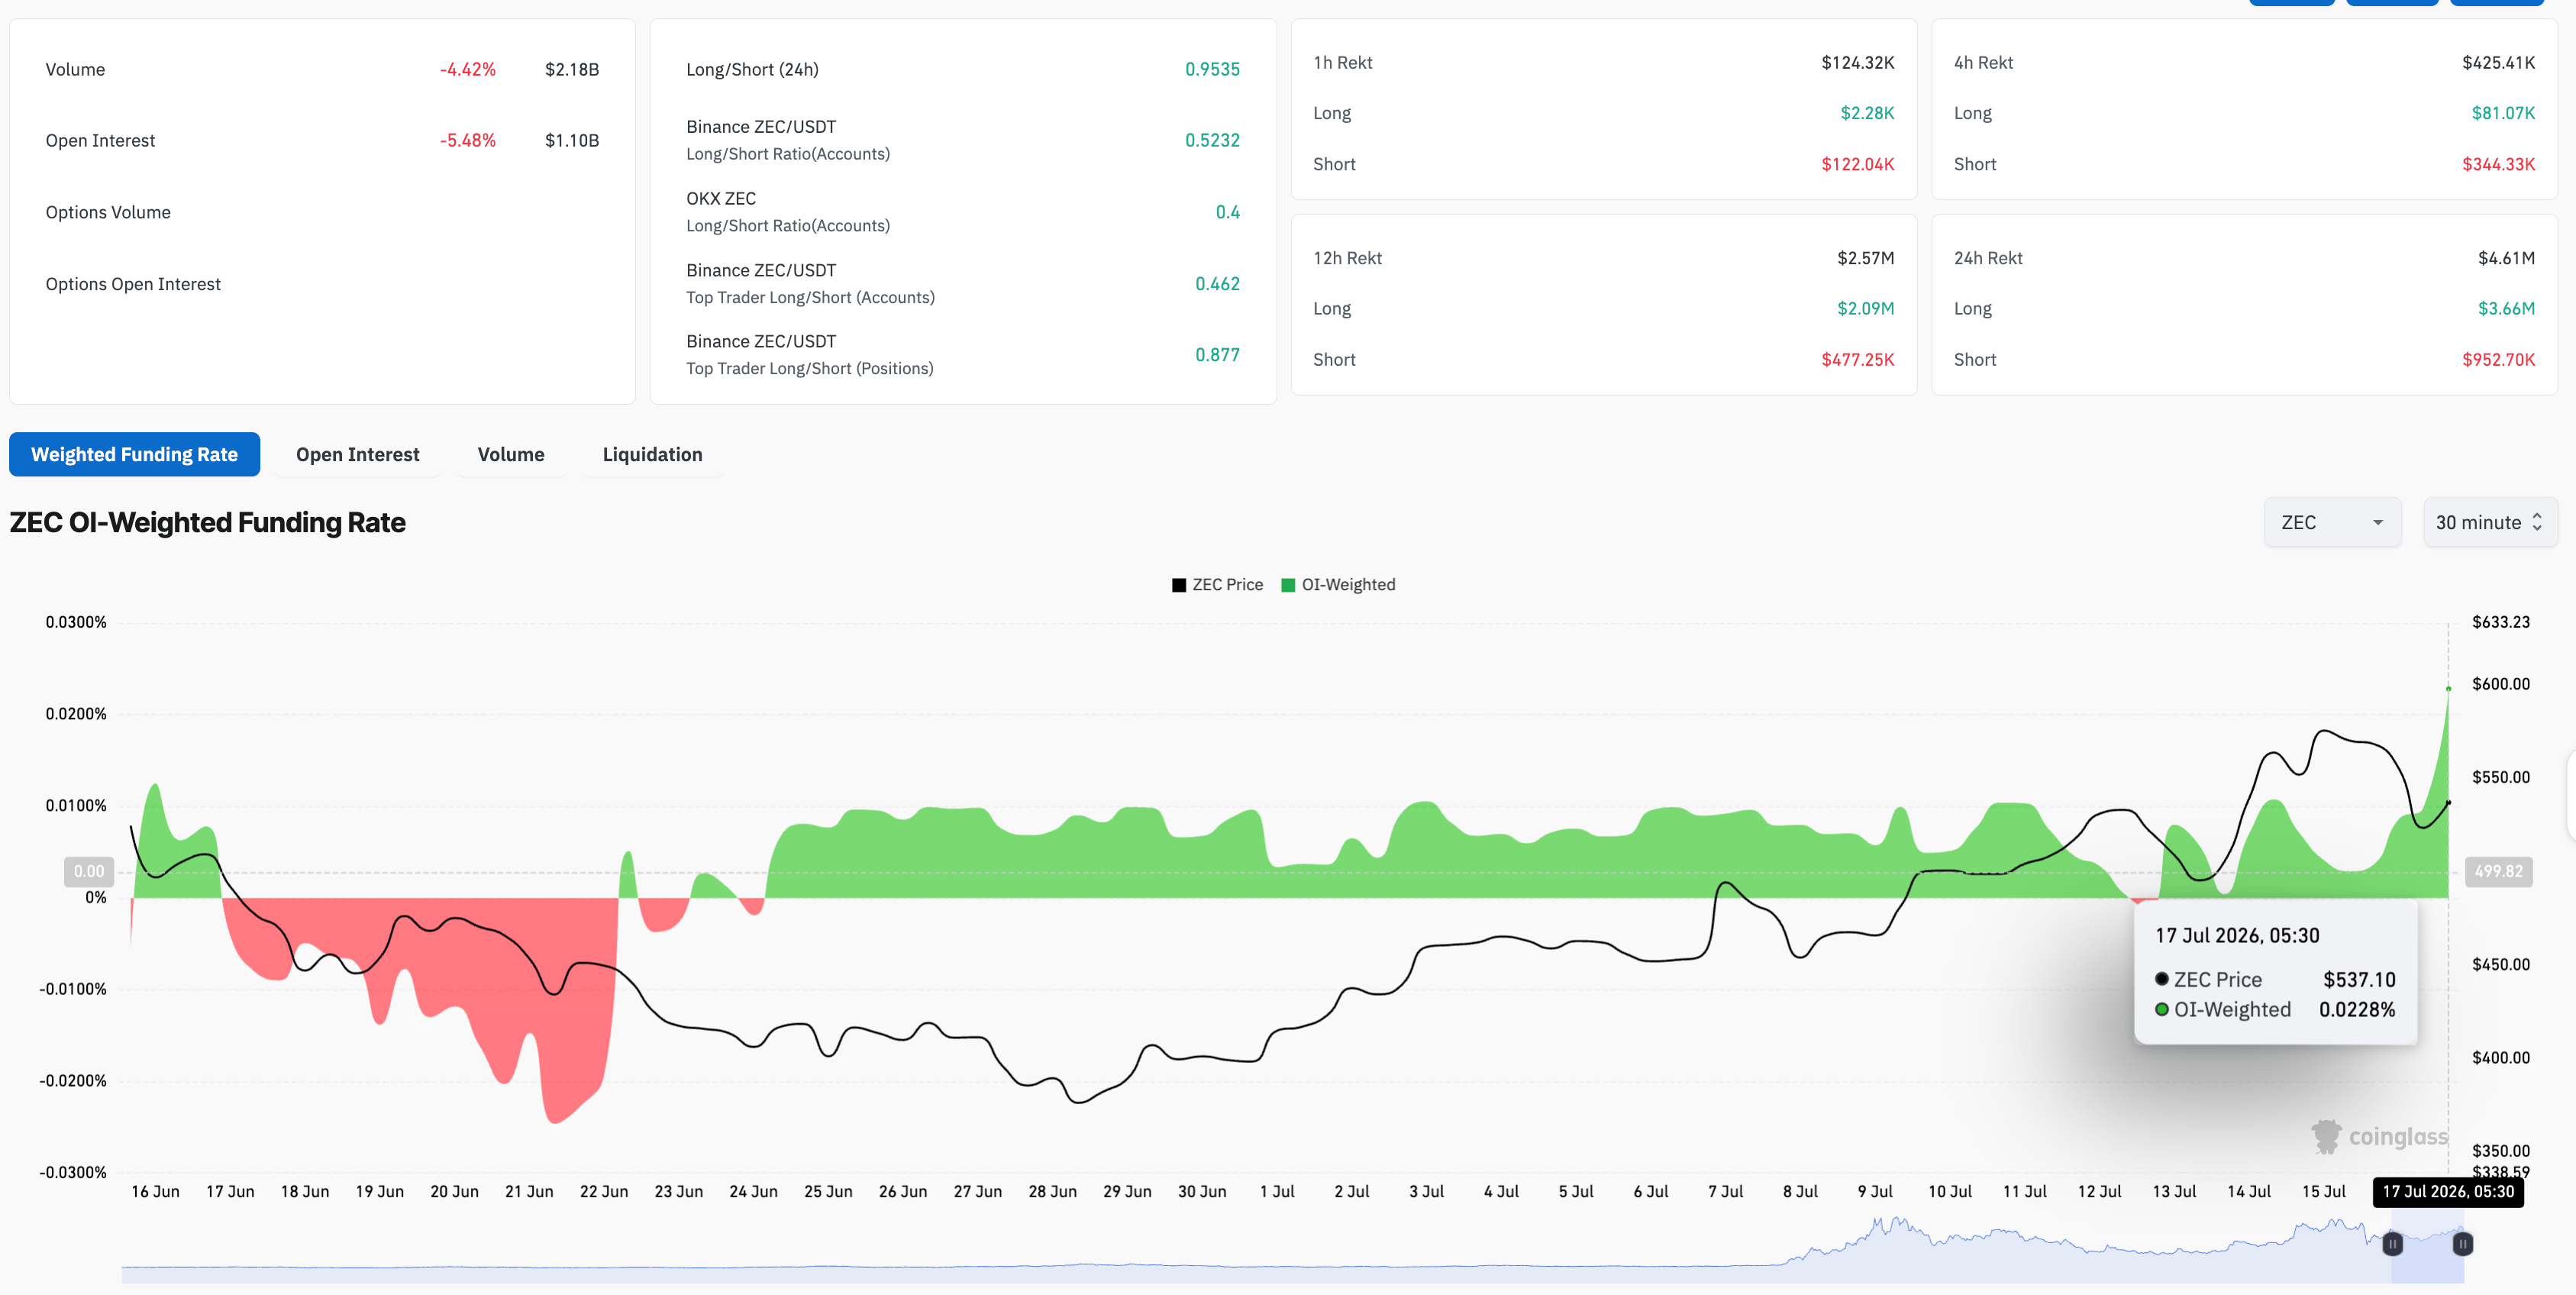
Zcash derivatives data. Source: CoinGlass

Will ZEC extend gains?

Zcash holds a bullish near-term bias above its 50-day Exponential Moving Average (EMA) at $476 and the 200-day EMA at $390. At the time of writing, ZEC is up 2% on Friday from its 78.6% Fibonacci retracement level at $520, measured over the $690 to $184 downswing, which reinforces a supported trend structure.

A steady upward trend could target the previous swing high of $690, and a breakout could extend the rally to the 127.2% Fibonacci extension at $987.

Momentum is constructive, with the Relative Strength Index (RSI) hovering near 58 with more upside before reaching the overbought levels. At the same time, the Moving Average Convergence Divergence (MACD) is rising into positive territory alongside its signal line, suggesting that buyers retain control.

Chart Analysis ZEC/USDT (Binance)
ZEC/USDT daily price chart.

On the downside, initial support is aligned with the 78.6% Fibonacci retracement at $520, where a deeper pullback could attract dip-buying interest near the 50-day EMA at $476.

(The technical analysis of this story was written with the help of an AI tool. Know more.)

Disclaimer: For information purposes only. Past performance is not indicative of future results.
placeholder
Will the Tech Rally Continue? The Technical Verdict on the NASDAQ 100 Riding a massive 32% post-earnings wave, the Nasdaq-100 is showing its first signs of exhaustion. We break down crucial exit and entry rules for long positions this week.
Author  Mitrade Team
6 Month 05 Day Fri
Riding a massive 32% post-earnings wave, the Nasdaq-100 is showing its first signs of exhaustion. We break down crucial exit and entry rules for long positions this week.
placeholder
Gold Price Analysis (XAU/USD): Gold Falls to 6-Month Low as Inflation Fuels Rate Hike Bets, A Buying Opportunity or a Falling Knife? Gold hit a 6-month low on Fed rate hike bets. However, strong central bank buying and technical indicators suggest potential tactical bounces and long-term accumulation windows.
Author  Mitrade Team
6 Month 12 Day Fri
Gold hit a 6-month low on Fed rate hike bets. However, strong central bank buying and technical indicators suggest potential tactical bounces and long-term accumulation windows.
placeholder
XRP Price Prediction for July 2026: Can Buyers Finally Break the Downtrend?XRP (XRP) price trades near $1.05, caught between a year-long downtrend and a sudden burst of buying.July has historically rewarded XRP holders. This year the month arrives with on-chain accumulation
Author  Beincrypto
6 Month 30 Day Tue
XRP (XRP) price trades near $1.05, caught between a year-long downtrend and a sudden burst of buying.July has historically rewarded XRP holders. This year the month arrives with on-chain accumulation
placeholder
Smart Money is Leaving Nvidia for This AI Chip StockNvidia stock price keeps sliding, yet the usual dip buyers are missing. Institutional money flow on the stock is the most negative of any major chip name, which means big investors are stepping back i
Author  Beincrypto
6 Month 30 Day Tue
Nvidia stock price keeps sliding, yet the usual dip buyers are missing. Institutional money flow on the stock is the most negative of any major chip name, which means big investors are stepping back i
placeholder
What to Expect From Ethereum (ETH) in July 2026Ethereum (ETH) enters July 2026 trading near $1,570, close to multi-month lows, after recording its first run of three consecutive red quarterly candles in its history.On-chain data and price charts n
Author  Beincrypto
7 Month 01 Day Wed
Ethereum (ETH) enters July 2026 trading near $1,570, close to multi-month lows, after recording its first run of three consecutive red quarterly candles in its history.On-chain data and price charts n
goTop
quote